IRAQ SUBDISTRICTS
- Territory Guide
- IRAQ SUBDISTRICTS
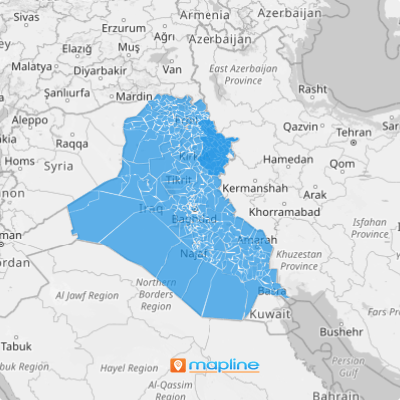
Incorporate Iraq subdistricts into your maps and gain a clearer understanding of regional demographics, market trends, and distribution patterns! Whether it’s optimizing logistics, planning sales territories, or conducting market analysis, an India subdistrict map provides invaluable data for decision-making. Bring your analytics to life by making a map of Iraq subdistricts an integral part of your analytical toolkit. This is the first step of revealing powerful market insights that can supercharge your business strategy.
Let’s dive in to how to create a map of Iraq’s subdistricts in Mapline, and how to get the most out of your data analysis.
WHAT ARE IRAQ SUBDISTRICTS?
Iraq subdistricts are administrative divisions within the country of Iraq. These divisions offer a granular view of local regions that can give brands a competitive edge.
For instance, a logistics company could optimize the location of their distribution centers by considering subdistrict boundaries, significantly cutting back on delivery expenses and mileage.
Or, a marketing team could target specific subdistricts and create custom-tailored regional campaigns for each district. By incorporating Iraq subdistricts into Mapline maps, businesses can truly make data-driven decisions rise above the competition in a competitive market.
ADD SUBDISTRICTS TO MAP
A clear understanding of boundaries is essential for effective data analysis and territory management. By visualizing each boundary, you can assess the performance of individual territories more accurately.
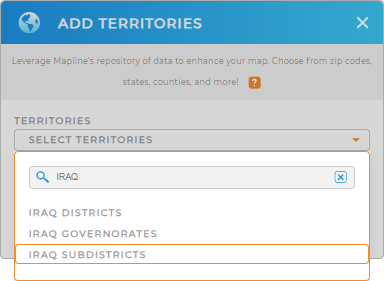
First, add a new territory from Mapline’s repository, then type IRAQ into the searchbar. In the drop-down menu, click IRAQ SUBDISTRICTS, and you’re all set!
Now you’re ready for Step 2.


Pro Tip: Gain a competitive edge by comparing Iraq territories including Iraq governorates, Iraq districts, and subdistricts that you can easily access in Mapline’s Repository. Analyze the factors affecting your business in different territories to get clear and visual insights to refine your strategies and stay ahead in the market.
CHOOSE SUBDISTRICT COLORS
Now that you’ve added the right territory boundaries, it’s time to customize them to get the most out of your data!
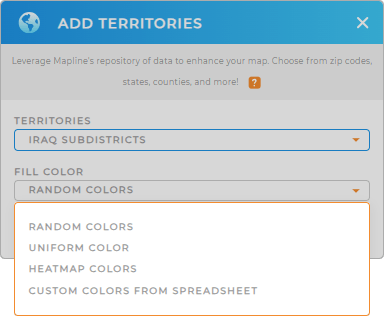
Do you want to enhance your map’s visual impact during presentations with vibrant colors? Or perhaps you have custom color codes from your spreadsheet that you’d like to incorporate?
Color styles enable you to accomplish all of these tasks and more, significantly enhancing the depth of your territory analysis! Just select the type of colors you’d like to use, then click OK. And that’s it!

GET NEW TERRITORY INSIGHTS
Wow, that was lightning-fast! Now, let’s take a look at some capabilities that can be a real game-changer for your territory analysis:
- Add a new dataset using Mapline connectors to focus more on gaining insights instead of managing imports
- Access reports on everything happening within each territory
- Leverage heat maps to unveil patterns and trends in your data


