- Blog
- Geo Mapping
- From Addresses to Insights: How to Map Addresses from Excel
Spreadsheets are one of the most common ways businesses manage customer and sales data, but numbers and addresses in rows can only go so far. To see the bigger picture, companies need to map addresses from Excel and uncover the geographic trends hiding in plain sight. Turning raw spreadsheet data into maps helps teams visualize customer density, optimize territories, and improve decision-making. With the right tools, mapping isn’t just about pinning points — it’s about exposing growth opportunities.
Why Businesses Map Excel Addresses
Spreadsheets tell you who your customers are, but not where they are. When teams map addresses from Excel, they add location context to their data. A basic spreadsheet of accounts can become a strategic visualization that reveals underserved regions or over-saturated territories. By learning how to plot addresses on a map from Excel, businesses gain insights that are impossible to see in tabular format. This shift from raw addresses to interactive maps turns static data into action.


Pro Tip: First, plot addresses on map from Excel free to get familiar with the workflow. Then, upgrade to our Geo Mapping suite to scale into advanced features like audience demographics, administrative territory boundaries, and customer density analysis.
How to Plot Multiple Addresses from Excel
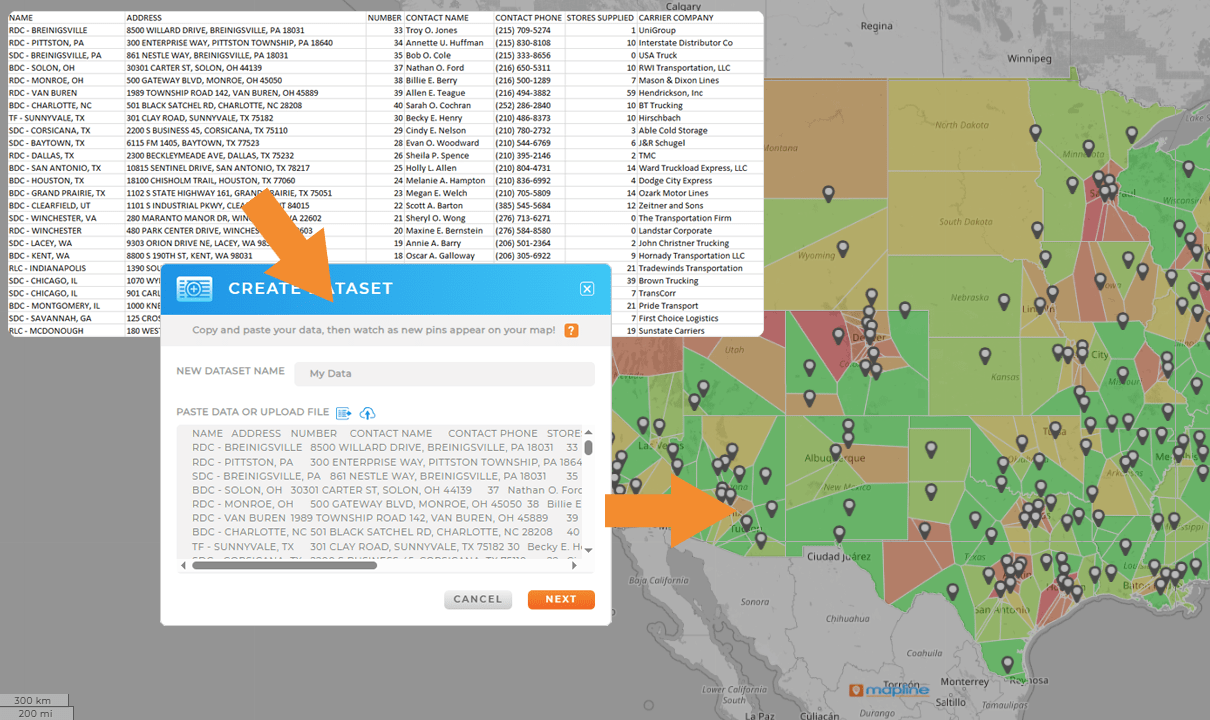
Modern mapping tools make it simple to map multiple addresses from Excel. By mapping excel addresses a spreadsheet, companies can generate a map that shows every customer, site, or sales lead in context. Powerful mapping software like Mapline allows users to map multiple locations from Excel without GIS training. Whether it’s hundreds of retail locations or thousands of customer addresses, visualization by geography makes it easier to identify patterns and optimize resources. Even a free workflow can get started by using a plot addresses on map from Excel free approach to test results before scaling.
From Spreadsheets to Pin Maps: Map From Excel in Seconds
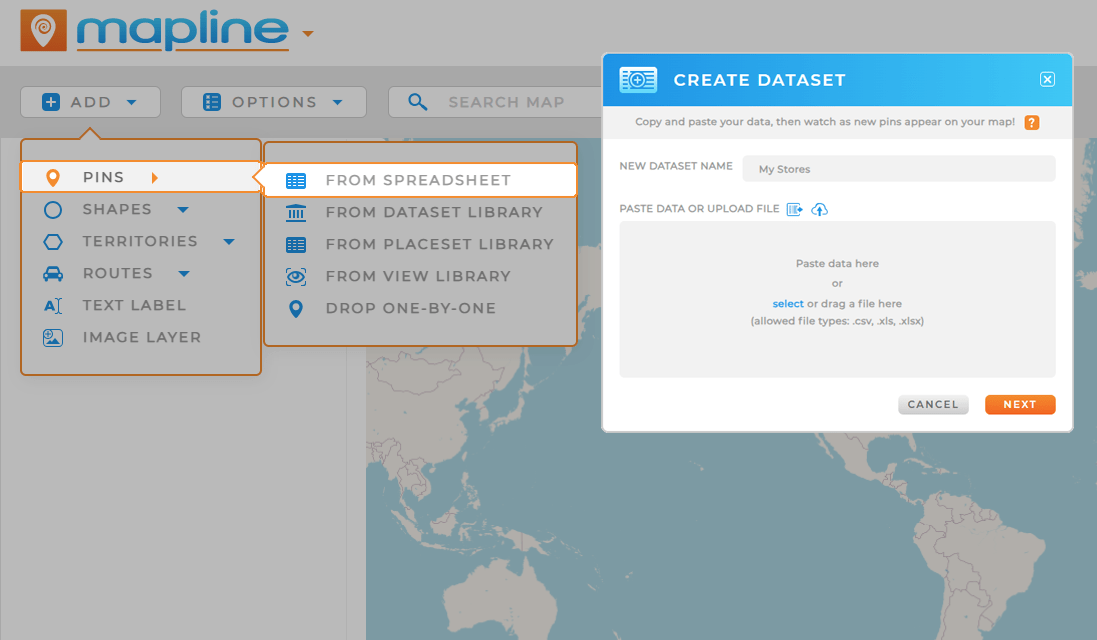
One of the most practical ways to use Excel data is by creating pin maps. With the right platform, companies can plot locations on a map from Excel quickly and share them across teams. A create pin map from Excel file process is straightforward — upload the file, define the address fields, and watch the map populate instantly. These pin maps do more than visualize; they serve as the foundation for territory management, route planning, and growth analysis.
Check out how easy it is to create a map from excel (it literally takes seconds):

Business Benefits of Mapping Addresses from Spreadsheets
When leaders move from mapping addresses in a spreadsheet to analyzing them geographically with an intuitive mapping software, they gain access to insights that drive smarter decisions. Visualizing addresses on a map highlights customer clusters, service coverage gaps, and regional performance trends that remain invisible in raw tables.
This shift makes it easier to spot new sales opportunities, allocate resources effectively, and optimize routes or territories. It also helps teams align strategy with real-world geography, ensuring decisions are both data-driven and practical. By transforming spreadsheets into interactive maps, organizations uncover patterns that directly impact growth and efficiency, turning static data into a powerful strategic tool.
Map Addresses from Excel to Conduct a Customer Location Analysis
Plotting customer addresses helps reveal geographic demand and underserved markets. With an interactive pin map, companies can refine sales strategies and expand into the right areas.

Add Locations from Your Spreadsheet for Sales Territory Optimization
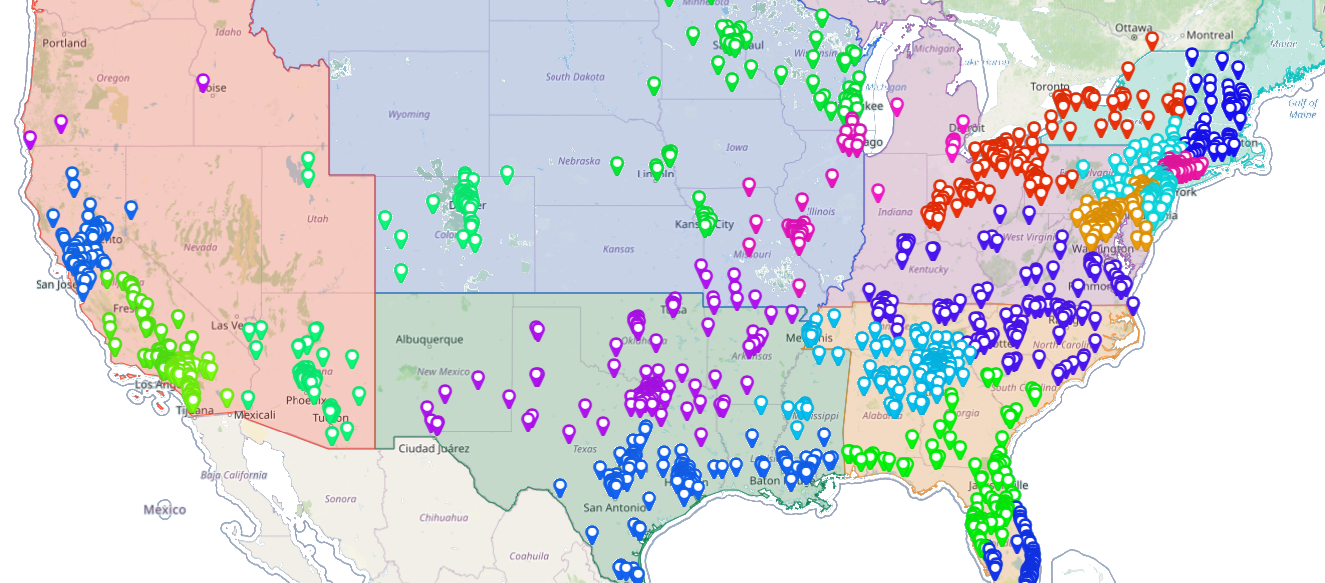
By visualizing accounts geographically, managers can redesign territories to reduce overlap, balance workloads, and maximize rep efficiency. A plot addresses on a map from Excel workflow provides the visibility required for smarter alignment.

Map multiple locations from Excel for Bulk Route Planning and Logistics
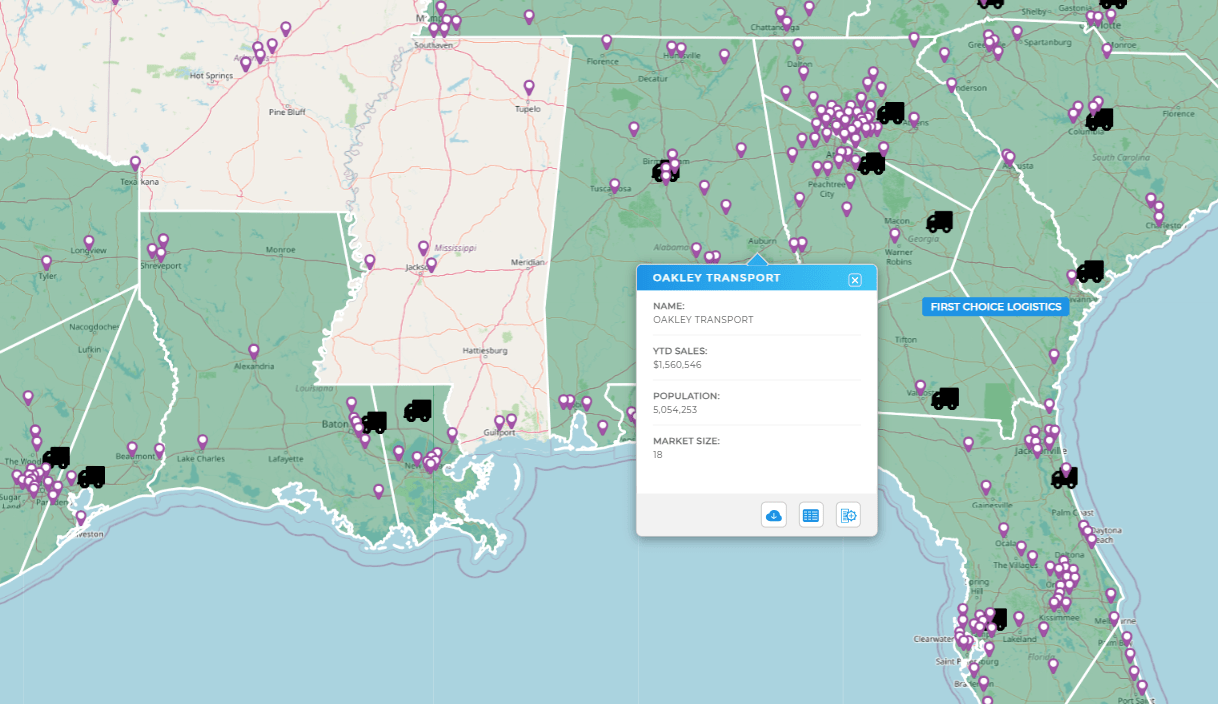
Mapping multiple locations from Excel data makes routing more efficient. Companies can identify the fastest paths, reduce travel costs, and improve service levels — all starting with simple address plotting.

Map Addresses from Excel for Site Selection Decisions
When evaluating new offices, stores, or warehouses, geographic visualization of customer and competitor locations provides confidence. A map Excel addresses workflow ensures data-driven site selection.

It means transforming a spreadsheet of addresses into a geographic map to visualize trends and opportunities.
Yes. Tools like Mapline let you map multiple addresses from Excel instantly by uploading a spreadsheet.
Yes. You can create a pin map from an Excel file to show customer or site locations in a clear visual format.
It helps with customer analysis, territory planning, logistics optimization, and site selection.
Yes. Many platforms, including Mapline, offer free trials or limited free tools to get started.
By exposing geographic insights that spreadsheets alone can’t show, helping managers optimize coverage and expand into new markets.
No. Business-focused platforms make it simple for non-technical users to plot data directly from spreadsheets.


