- Blog
- Geo Mapping
- 10 Industries That Rely on a Heatmap Analytics Tool for Business Growth
Know more about heatmap analytics! Heat maps aren’t just pretty visuals—they’re one of the fastest ways to see where opportunities exist and where resources may be wasted. By transforming raw data into color-coded insights, businesses across industries can make smarter decisions that impact growth, efficiency, and profitability. A heatmap analytics tool is especially powerful because it adapts to different industries, helping each one tackle its most pressing challenges. From sales coverage to store placement, heat maps deliver clarity at a glance.
Turn to Heat Map Analytics to Drive Business Growth
Heat maps simplify decision-making by showing what’s working and what isn’t. Instead of combing through rows of numbers, managers and executives see immediate insights into customer behavior, geographic distribution, and resource allocation. These visuals reveal where sales reps are stretched too thin, where retail stores are underperforming, or where untapped markets lie waiting. Because they highlight both strengths and weaknesses, heat maps empower businesses to allocate resources strategically, maximize ROI, and reduce operational waste. For industries where margins are tight and competition is fierce, that clarity is game-changing.
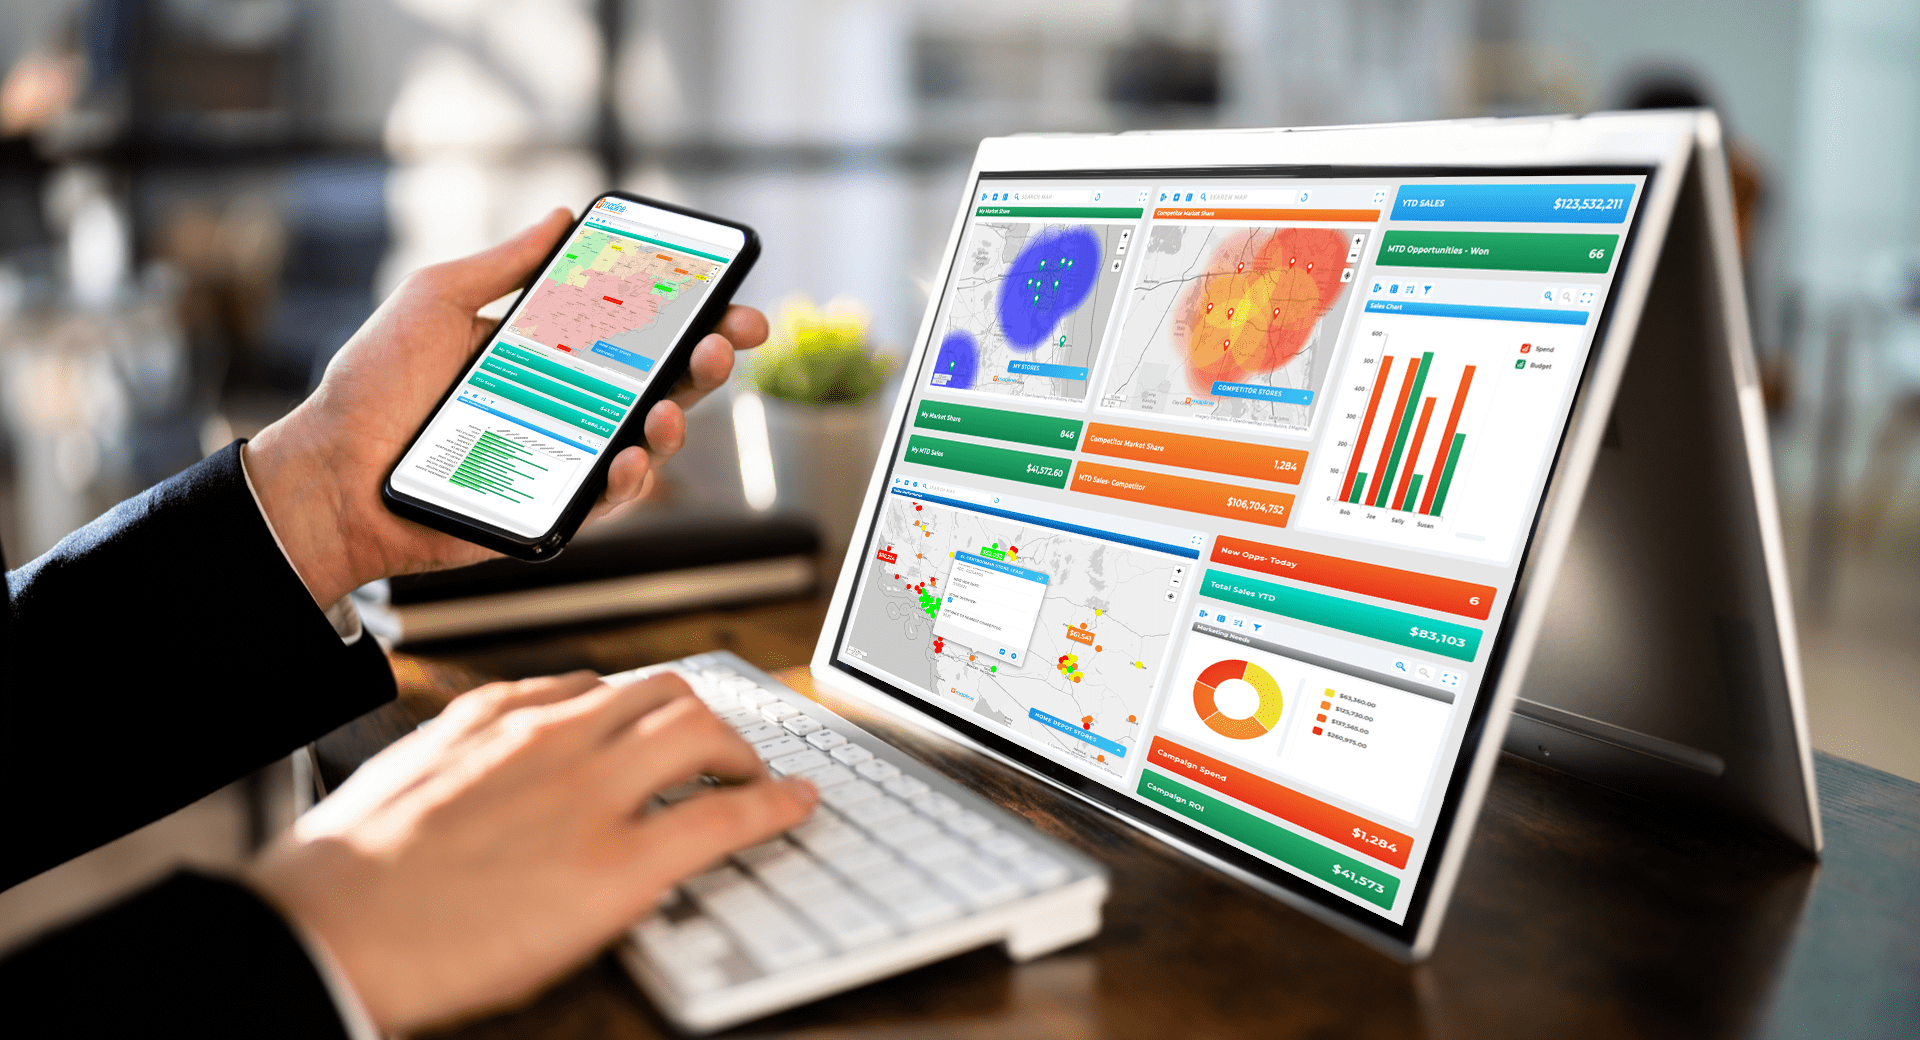

Pro Tip: Don’t stop at visualization—layer multiple datasets together. For example, combining sales data with demographic heat maps can reveal not just who you’re serving, but who you’re missing. That’s how Geo Mapping turns a heat map from a static report into a growth strategy.
10 Industries Where Heat Map Analytics Make a Difference
Heat maps are not confined to one niche—they’re a universal tool that adapts to the needs of any industry. Whether the goal is to expand into new markets, optimize resources, or improve customer satisfaction, heat maps provide a visual shortcut to smarter decisions. By highlighting where opportunities are concentrated and where gaps exist, they remove guesswork from planning and execution. Industries as diverse as retail, healthcare, logistics, and public services use heatmap analytics to balance efficiency with growth. Each sector benefits differently, but the outcome is the same: better visibility, more informed choices, and a stronger competitive edge.
Retail and Franchise Networks
Retailers and franchises use store heat maps to visualize performance by location, identify underserved regions, and plan new store launches. By comparing sales data with demographic heat maps, decision-makers can pinpoint where demand is high but coverage is lacking. This allows them to expand intelligently and avoid oversaturating markets.
Field Sales and Distribution
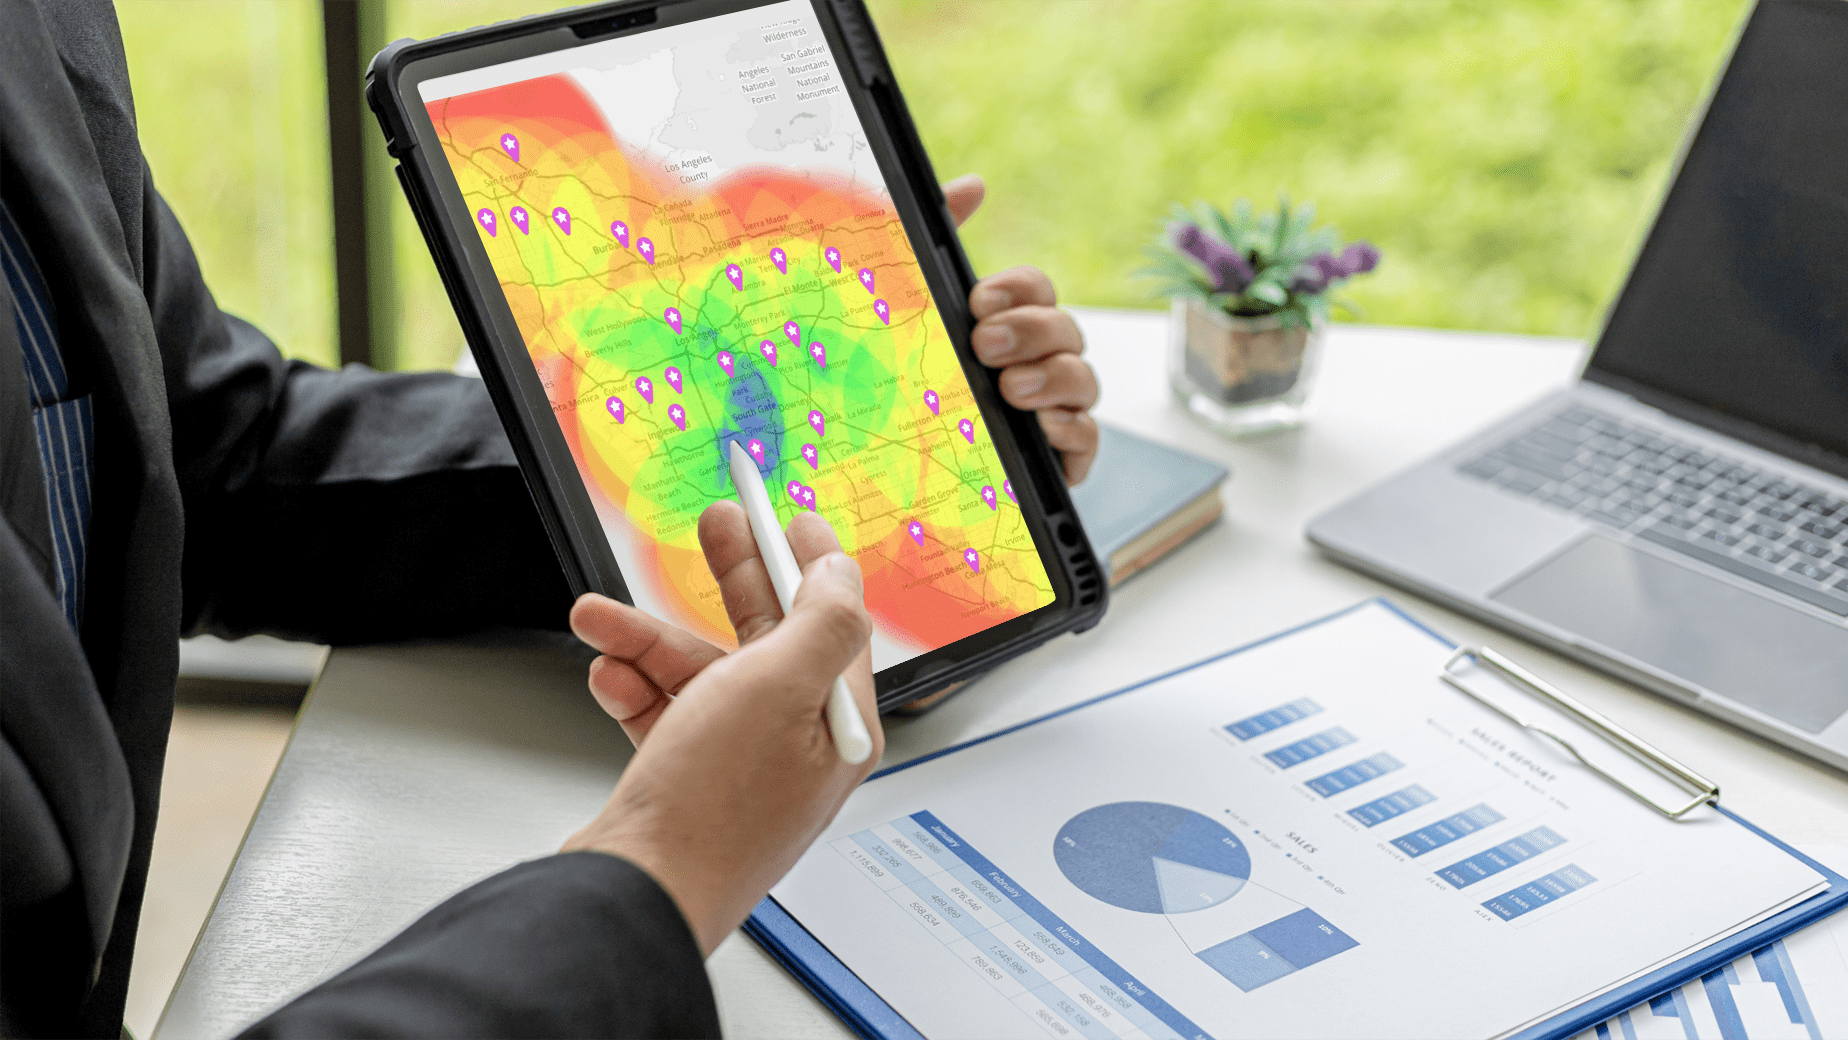
Sales teams rely on customer heat maps to optimize territories and ensure reps are spending time in the right places. A heatmap analysis tool can highlight areas with high customer density that lack rep coverage, or regions where travel time is reducing efficiency. The result is smarter territory planning and higher rep productivity

Logistics and Supply Chain
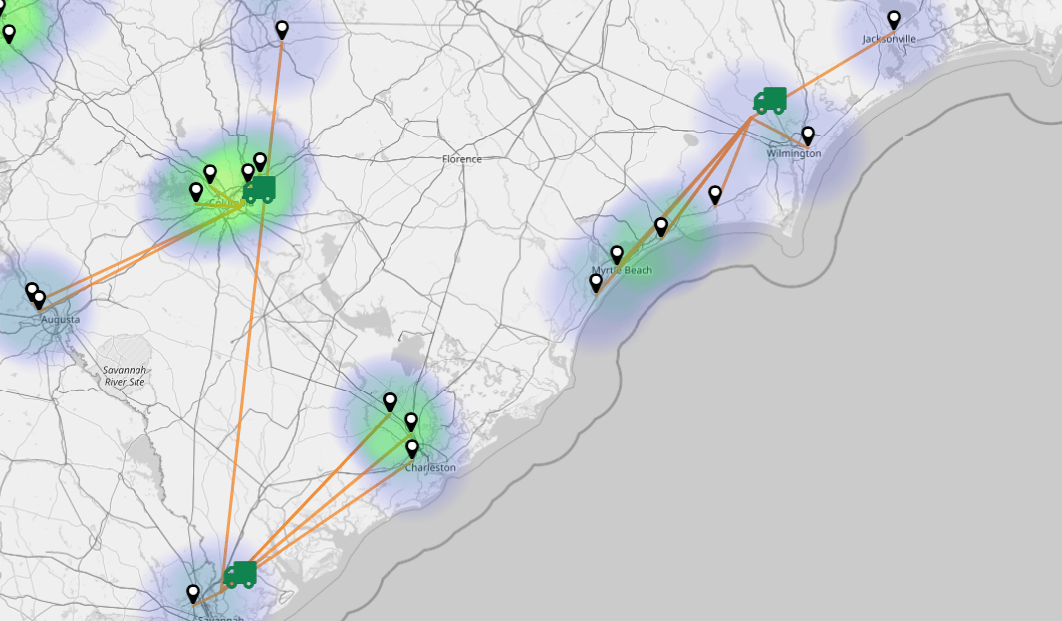
Heat maps help logistics teams cut costs by showing where bottlenecks occur in deliveries. For example, demographic heat maps paired with warehouse locations can reveal where last-mile costs are too high. Adjustments like adding a new hub or rerouting deliveries become clear once the data is visualized.
Healthcare Providers
Hospitals, clinics, and service providers use heat maps to analyze patient demand across regions. A geographic heat map can show underserved communities where opening a new clinic would improve care access. For existing facilities, heat maps highlight resource utilization so staffing aligns with patient needs.
Real Estate and Development
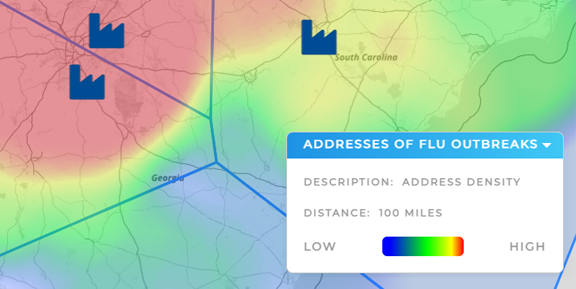
Real estate firms use heat maps to track property values, demographic trends, and neighborhood growth. A retail store heat map can indicate where businesses succeed, while a demographic heat map can reveal where population shifts create new opportunities. This level of foresight is crucial in competitive property markets.

Marketing and Customer Insights
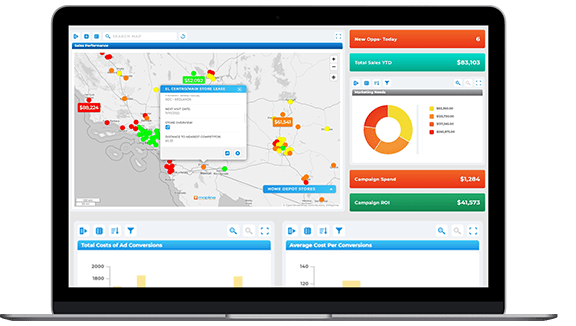
Marketers use heatmap analytics to visualize campaign performance by region. A customer heat map can identify where engagement is highest, or where leads aren’t converting. This makes it easier to shift budget and strategy to maximize ROI.
Utilities and Service Providers
Utility companies rely on heat maps to plan service coverage and anticipate demand spikes. For example, electricity providers use geographic heat maps to forecast where peak usage may require infrastructure upgrades. This ensures reliability while keeping costs predictable.

Manufacturing
Manufacturers use heat maps to optimize distribution networks and visualize supply chain risk. By mapping supplier locations against production facilities, they can identify where vulnerabilities exist if a supplier shuts down or experiences delays. This proactive planning saves time and money.

Education Institutions
Schools and universities use heat maps to track student enrollment patterns and community demand. A heatmap analysis tool can reveal which neighborhoods are growing quickly, helping administrators plan for future facilities and programs.

Government and Public Services
Public agencies rely on demographic heat maps to allocate resources, whether it’s fire stations, police coverage, or community programs. By understanding population density and distribution, they can provide services more equitably and efficiently.

Getting the Most Out of Your Data with Heat Map Analytics Tools
A heat map is only as powerful as the actions you take with it. Simply seeing concentrations of activity is helpful, but advanced mapping tools turn those visualizations into strategies that change outcomes. By layering business metrics with location data, mapping software empowers you to uncover hidden inefficiencies, spot untapped markets, and reallocate resources where they’ll have the most impact. From sales teams looking to balance territories to operations leaders trying to cut delivery costs, heat maps become a daily decision-making tool. The key is using features that allow you to go beyond static views and instead generate dynamic, actionable insights that align with your business goals.
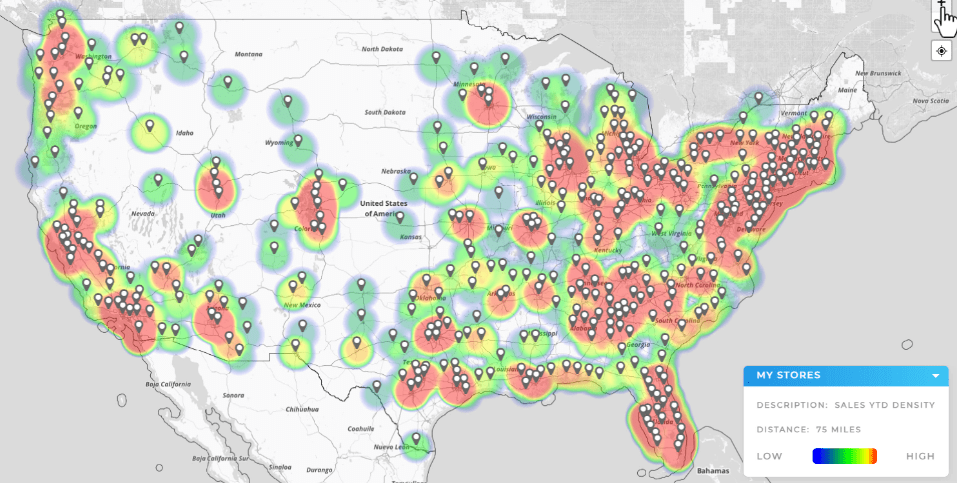
Radial Heat Maps for Coverage Clarity
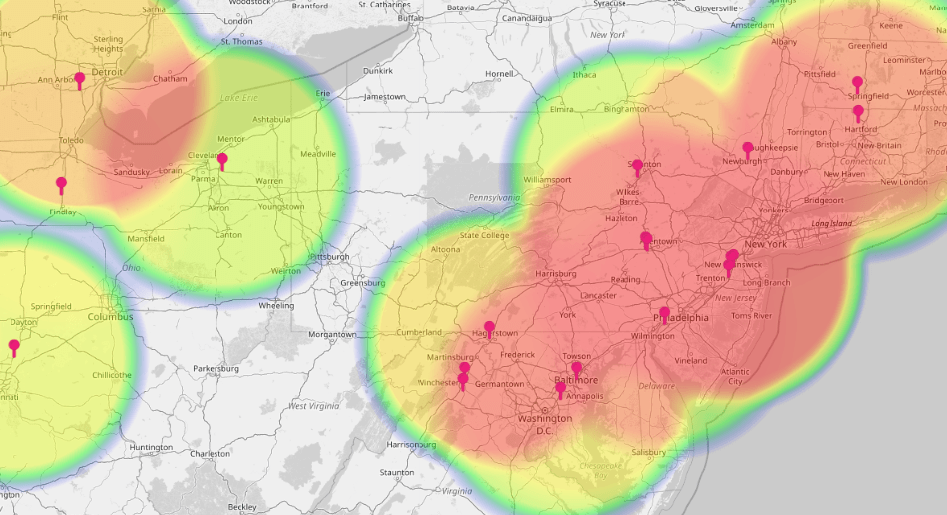
Radial heat maps help teams instantly see how far their influence extends from key hubs like warehouses, service centers, or retail stores. This makes it easier to identify underserved regions and ensure resources are distributed in line with customer demand.
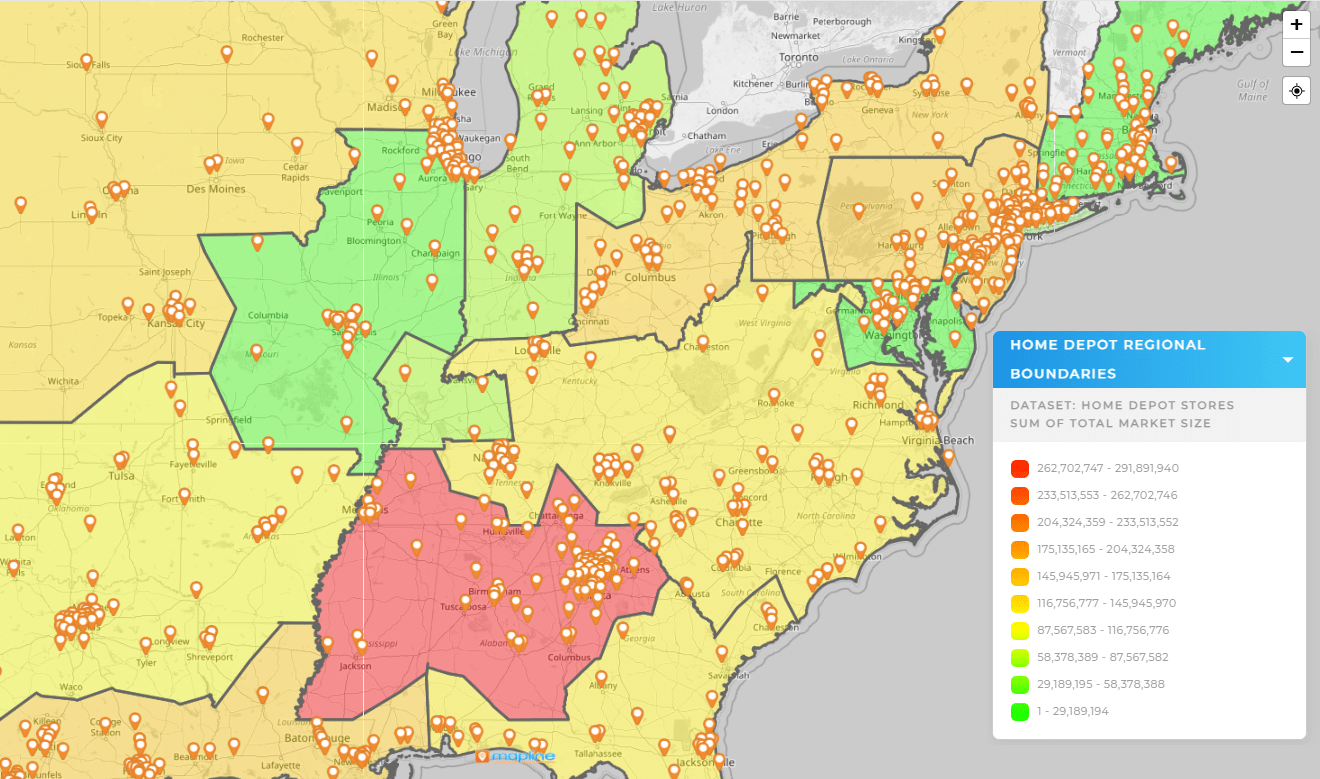
Dynamic Territory Maps
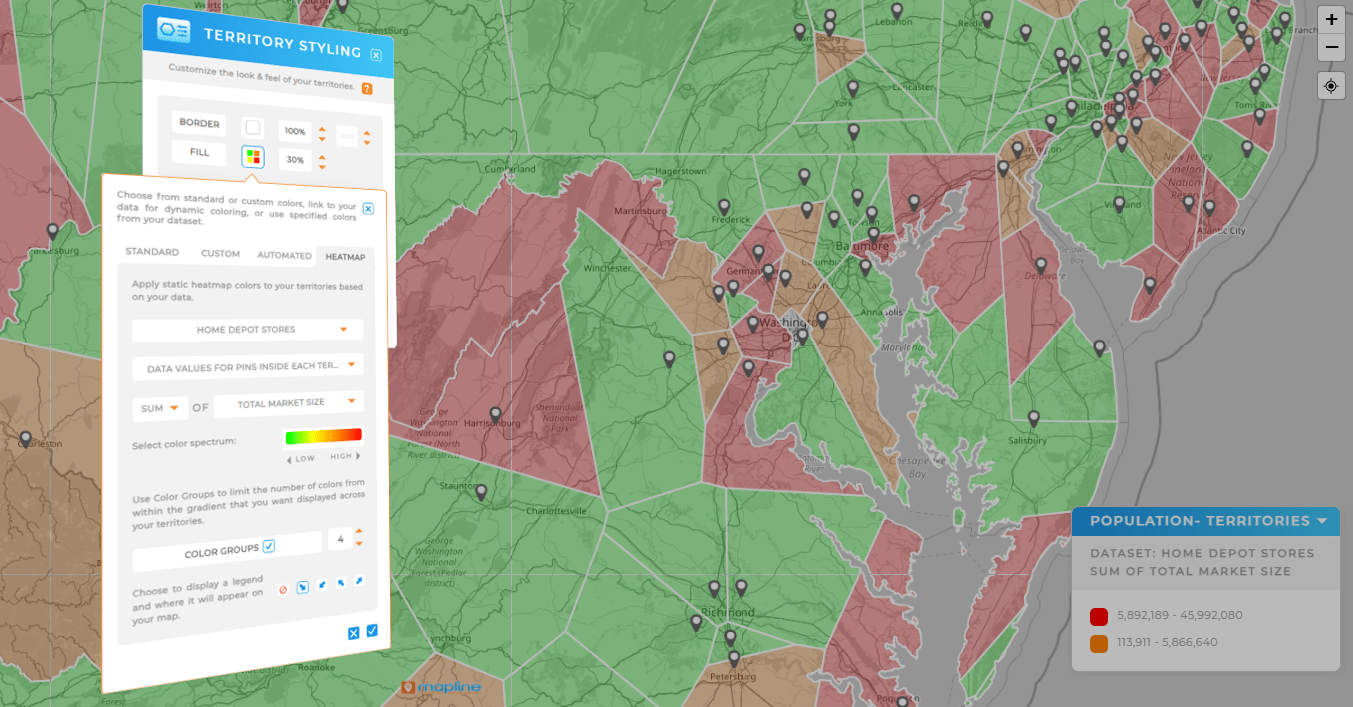
Heat maps combined with territories show not just density but performance by defined regions. Teams can quickly evaluate whether territories are balanced, which ones are overperforming, and where adjustments will unlock growth.
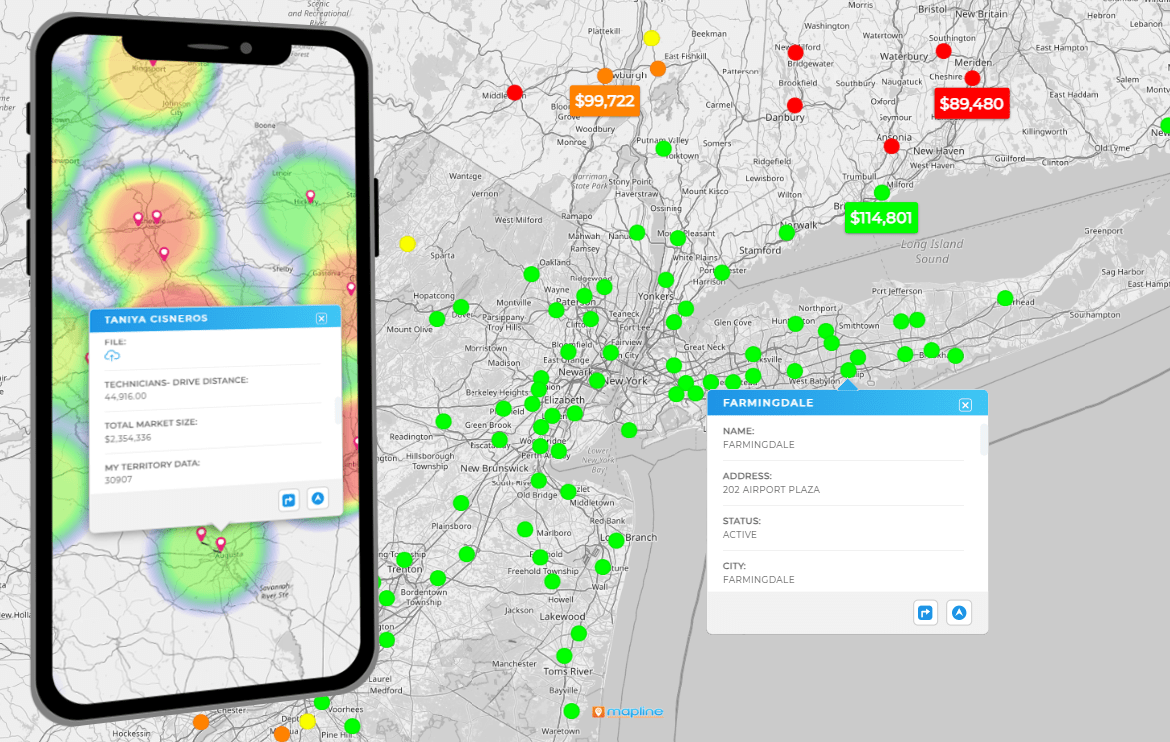
Pin Styling That Tells a Story
Dynamic pin styling turns raw data into an at-a-glance dashboard. By customizing colors, sizes, or shapes based on metrics like revenue or volume, managers see patterns that spreadsheets alone can’t reveal.
Layering Multiple Data Sets
Heat maps become more powerful when paired with external or proprietary data, such as demographics or government boundaries. This creates a full picture of where opportunities exist and provides the context needed to make confident decisions.
Metrics to Track With Heat Maps
Heat maps become even more powerful when paired with the right metrics. Sales teams may track revenue and customer count, while retailers focus on store performance and demographics. Logistics teams monitor delivery costs and fulfillment times, while healthcare organizations measure patient coverage. By combining relevant data with visualization, businesses turn raw numbers into actionable strategies that drive measurable growth.

The Impact Heat Map Analytics Delivers for Clients
The ultimate measure of a heat map generator is the impact it has on real businesses. Heat maps deliver measurable improvements across sales, operations, and strategy by turning raw data into actionable insights. Clients see cost savings through smarter routing, increased revenue from better territory alignment, and greater agility when responding to shifting market conditions. The ability to visualize data in real time makes teams more proactive and less reactive, leading to more consistent performance and stronger results. Over time, this translates into higher ROI and a sustainable competitive advantage.
Heatmap Analytics for Smarter Territory Alignment
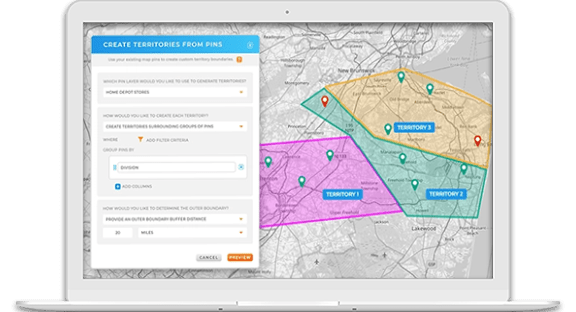
Clients report faster, more accurate decisions when balancing workloads across sales reps. This not only prevents burnout but also ensures fair opportunity distribution that drives higher close rates.
Heatmap Analytics for Reduced Delivery Costs
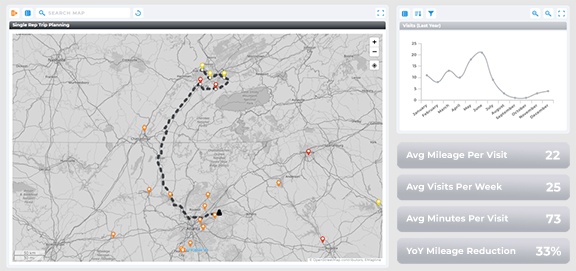
By pairing heat maps with routing features, companies cut unnecessary miles and avoid costly overlap in service areas. This translates directly into lower fuel expenses and faster delivery times.
Heatmap Analytics for Accelerated Market Expansion
Heat maps highlight where new opportunities lie, enabling businesses to expand strategically instead of guessing. Whether it’s opening a new store or targeting a new region, the result is faster, safer growth.
Heatmap Analytics for Greater Customer Satisfaction
Ut enim ad minim veniam, quis nostrud exercitation ullamco laboris nisi ut aliquip ex ea commodo consequat. Duis aute irure dolor in reprehenderit in voluptate velit esse cillum dolore eu fugiat nulla pariatur. Excepteur sint occaecat cupidatat non proident, sunt in culpa qui officia deserunt mollit anim id est laborum.
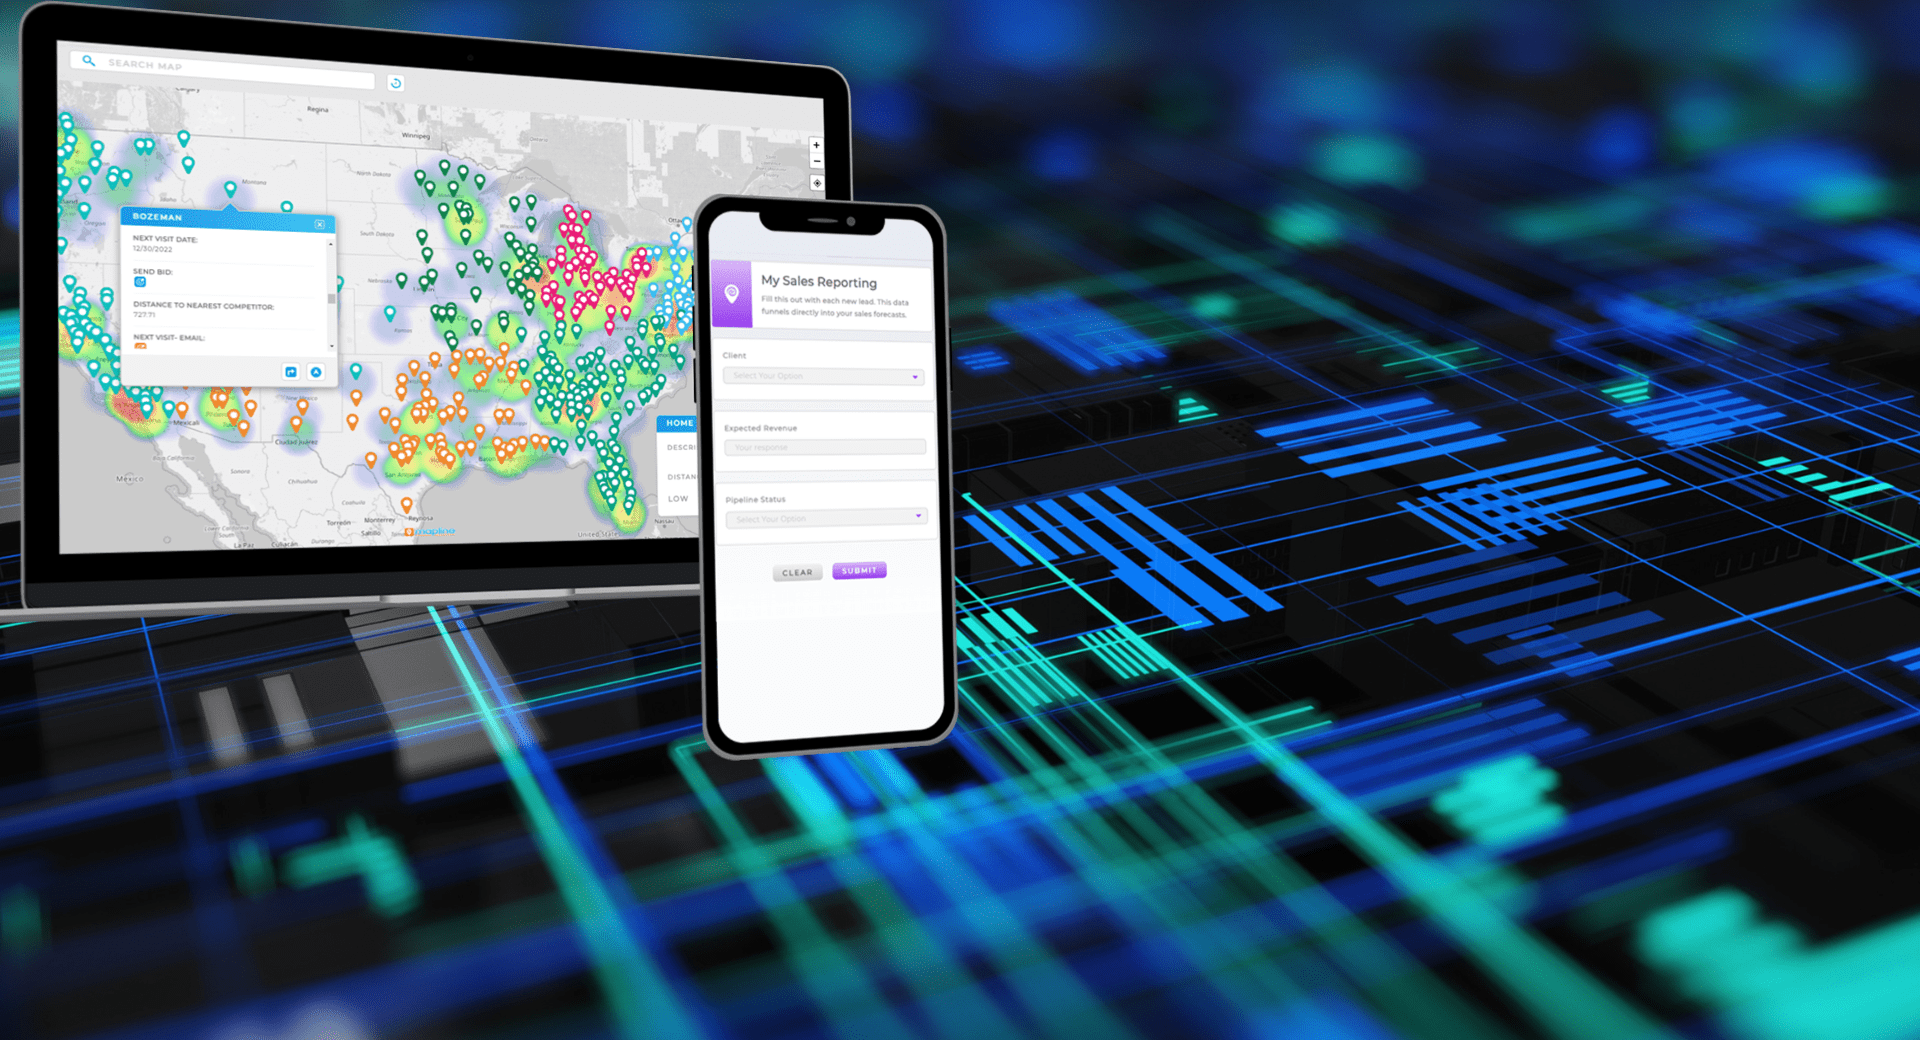
A heatmap analytics tool turns raw business data into color-coded maps that make trends, gaps, and opportunities easier to see.
Yes. Even small businesses can use customer or store heat maps to find underserved areas, optimize territories, or cut inefficiencies.
A geographic heat map shows patterns across physical space, like population density, while a sales heat map focuses on revenue, leads, or customer activity by region.
Not at all. Modern heat mapping tools let you upload data from Excel and create actionable visuals in just minutes.


