New Updates
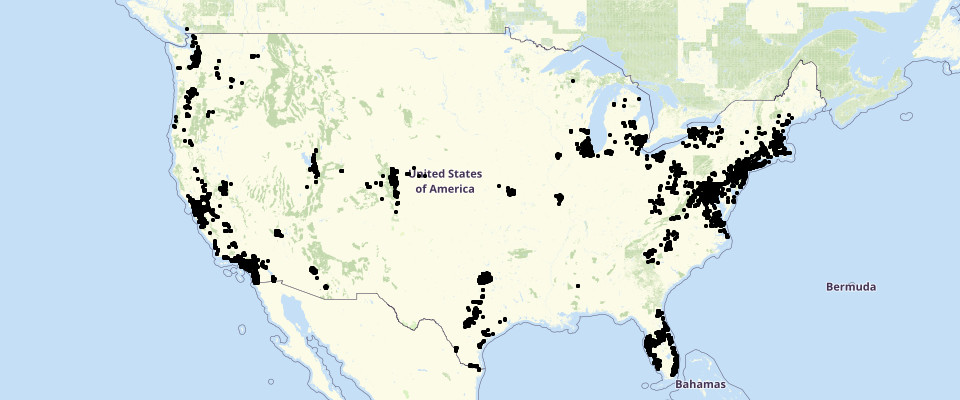
Dot Density
This new addition reveals where locations are clustered. Many users have been asking for this feature because this is especially useful when mapping locations or phenomena that change dramatically over an area.
Ability to Save Column Widths on Spreadsheet Page
You can now slide the ruler of the columns in any way you want, and it will be saved. When maps are shared, those with whom the maps have been shared will also see the saved column widths of the spreadsheet.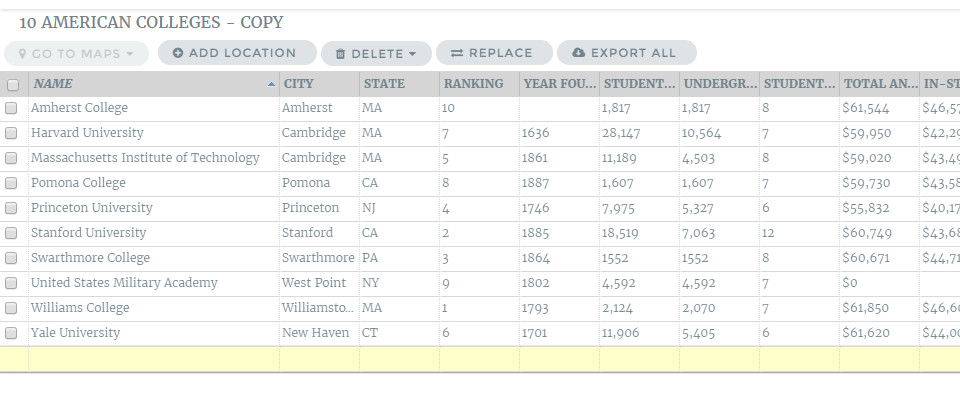
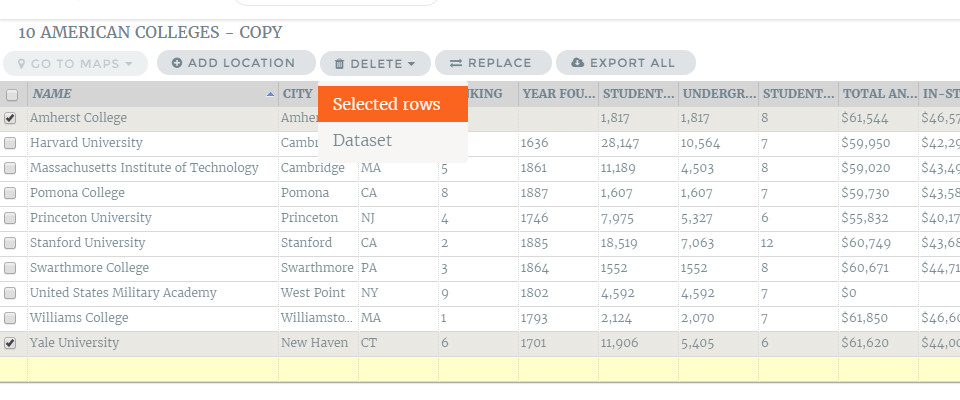
Ability to Delete Selected Rows from a Dataset
We’ve made it easier to delete locations from your datasets. Now you don’t need to click the locations one by one to delete them. Just click the rows that you want to delete, click the “Selected rows” on the drop down arrow of “Delete” button and bam! Your locations will be deleted all at once.
Added Support for Degree Formatted Coordinates
Mapline can now support decimal and degree coordinates.
Miscellaneous Bug Fixes
There are a few bugs that we captured and fixed. We thank you all for your feedback and queries. If not for them, we would not be able to make these updates successful.
Let us know if you have more suggestions. We are open to feedback. What else would you like to be simpler to accomplish while mapping with us?