Close
WE'RE ALL ABOUT
YOUR
SUCCESS
HOW WOULD YOU LIKE TO GET IN TOUCH:
Email
Calendar
Close
READY FOR MAPLINE TO
ROCK
YOUR WORLD?
Our team is ready to help you eliminate wasted time, maximize your sales coverage, and supercharge your team's efficiency. We'll provide the expert guidance and tailored solutions you need to get things right.
Stop missing out on valuable opportunities. Reach out, and we'll get started on optimizing your territories today!
Email
Calendar
Close
READY FOR MAPLINE TO
ROCK
YOUR WORLD?
WE WANT YOU TO EXPERIENCE EVERY-THING YOU'VE BEEN MISSING BY STARTING YOUR FREE TRIAL TODAY! OUR TEAM IS READY TO HELP CHANGE YOUR LIFE. SO REACH OUT AND WE'LL GET THINGS STARTED!
Email
Calendar
Close
READY FOR MAPLINE TO
ROCK
YOUR WORLD?
Discover the potential of Mapline with a LIVE DEMO from our experts. This is your chance to see it in real-time and get all your questions answered. Connect with us to schedule your demo today!
Email
Calendar
Close
Give us a call. We'd love to talk!

+1 800.969.1454

Close
Give us a call. We'd love to talk!

+1.888.670.3795

Close
Close
Geo Mapping Starter Close

Experience the power

Get ready to see your data in a whole new way!
Geo BI Trial Close

Experience the power

Get ready to see your data in a whole new way!
Your 7-day free trial awaits!
Geo Routing Trial Close

Experience the power

Get ready to see your data in a whole new way!
Your 7-day free trial awaits!
Geo Scheduling Trial Close

Experience the power

Get ready to see your data in a whole new way!
Your 7-day free trial awaits!
Close
Close
From County Map
to State Map:
Mapping with Official Boundaries
From County Map
to State Map:
Mapping with Official Boundaries
  • Blog
  • Geo Mapping
  • From County Map to State Map: Mapping with Official Boundaries

Every county, city, and state tells a different story—and official boundaries help you see how they connect. Whether you’re managing regional sales, tracking compliance, or planning new locations, boundary maps give structure to your strategy. They transform a mass of data into a clear visual hierarchy, showing how smaller areas fit into the bigger picture. By using the best mapping software to visualize these official borders, you can make sense of complex regional data and plan confidently at every level.

How Official Boundaries Impact Your Business Strategy

Official government boundaries—like county and state lines—aren’t just cartographic details. They represent regulatory, economic, and demographic divisions that influence how your business operates. Mapping within these borders helps you identify trends and constraints specific to each area, ensuring that strategy aligns with the realities of local jurisdictions. When your maps reflect the same boundaries used by government agencies, your decisions carry precision and credibility.

magnifying glass with a checkmark inside

Pro Tip: Start small by mapping a single dataset, like sales or customer locations, onto county or ZIP code boundaries in Mapline. Geo Mapping makes it easy to experiment with color-coding, filters, and labels to quickly see which regions perform best. These visual insights can immediately inform marketing campaigns, sales outreach, or resource allocation—turning your data into actionable strategies.

Types of Boundary Maps

From localized insights to national overviews, the best mapping software helps you move fluidly between different boundary levels. Each type of boundary reveals a different layer of business intelligence—from granular county data that highlights local patterns to state-level maps that show big-picture trends. A well-structured boundary map makes it easier to visualize performance, compliance, and opportunity across different regions. By switching between county, state, or even national boundaries, you can uncover relationships that might otherwise remain hidden. Each boundary type brings unique strategic advantages, empowering teams to make smarter, location-based decisions that drive measurable results.

County Boundary Maps

County maps reveal local nuances—like population density, service zones, and regional regulations. Use them to visualize customer clusters, delivery coverage, or county-specific performance metrics that influence daily operations.

State Boundary Maps

State maps give you a broader view of trends and growth opportunities. Visualize how state policies, tax structures, and infrastructure projects affect your network. When you create a state map in Mapline, you can easily compare performance and compliance across state lines.

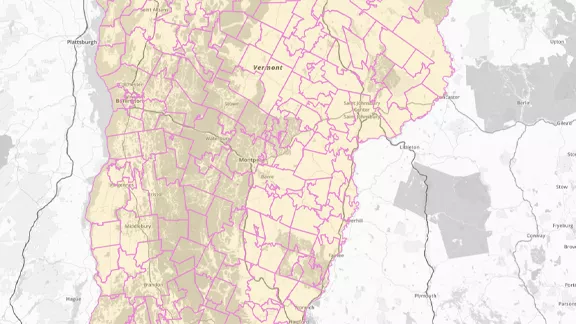
County Line Maps for Local Planning

For teams managing service routes or regional assets, county line maps simplify logistics. They help identify where operations cross into new jurisdictions, reducing redundancy and improving coordination.

Add U.S. county subdivisions to your map in Mapline

State Line Maps for Strategic Oversight

At a leadership level, a state line map shows macro-level insights. Visualize entire regional markets, track expansion zones, or analyze where population growth aligns with future opportunity.

National Parks and Natural Boundaries

Mapline also lets you layer official geographic features—like national parks or natural borders—onto your maps. These layers help teams in industries like construction, utilities, and logistics plan around protected areas or terrain challenges.

Map of U.S. National Parks

How to Create Boundary Maps in Seconds

With Mapline, you can create county or state maps in just minutes. Upload your location data, choose your boundary type, and watch it instantly visualize in the right geographic context. Whether you’re working with a single region or mapping your entire national footprint, Mapline keeps it clear, accurate, and scalable. Real-time overlays let you compare performance, population, or compliance data without jumping between systems—everything you need is on one map.

Upload Your Data

Start by importing your dataset into Mapline. You can upload Excel files, CSVs, or even copy and paste data directly from Google Sheets. Make sure your file includes location identifiers like addresses, ZIP codes, or latitude and longitude so Mapline can plot your data accurately. Once uploaded, Mapline will automatically process your data and prepare it for mapping.

Create a New Map

With your data uploaded, click the orange ADD button in your Mapline menu and select NEW MAP.

Then, give your map a name and click OK. This step creates your new map and saves it to the Maps Library for future use.

Create instant customer maps and manage your sales territories

Add Boundary Lines to Your Map

Use Mapline’s boundary features to add visual context to your map. You can overlay preloaded boundaries like counties, states, or ZIP code areas, or upload your own shapefiles for custom regions. These boundaries make it easier to identify trends, compare areas, and make your map more informative.

Add map territories from Mapline's worldwide repository of government and administrative boundaries

Style & Customize Your Map

Mapline lets you customize your map to highlight key insights. Change the color, shape, and size of pins, add labels, or include interactive pop-ups. Use Mapline’s styling tools to make your map visually engaging and easy to interpret for reports, presentations, or decision-making.

screenshot of the updated territory styling lightbox in Mapline

Do More With Your Data Using Government Boundary Maps

Government boundary maps—like counties, states, and ZIP code areas—unlock new ways to extract value from your business data. By visualizing your data within these defined regions, you can spot trends, uncover opportunities, and make smarter, data-driven decisions. Mapline makes it easy to overlay your information on these boundaries, revealing insights that spreadsheets alone can’t show. Whether you’re optimizing sales, targeting marketing campaigns, or planning logistics, understanding your data geographically adds a strategic layer that drives better business outcomes. Using boundary maps helps you move from raw numbers to actionable intelligence.

Analyze Regional Sales Performance

Use Mapline to plot sales data within county, state, or ZIP code boundaries. Seeing sales by region highlights top-performing areas, underperforming territories, and trends over time, helping you allocate resources and refine strategies.

Analyze performance by region with Mapline

Optimize Territory Planning

Define and adjust sales or service territories with Mapline’s boundary maps. Analyze customer locations within regions to balance workloads, minimize travel, and improve coverage efficiency.

Identify Market Opportunities

Combine demographic, competitor, or customer data within Mapline to uncover untapped markets. Boundary maps reveal areas with high potential for growth or regions where your products and services are underrepresented.

Visualize market penetration and other key metrics with mapline's data mapping software

Enhance Logistics and Distribution

Use boundaries to plan shipping routes, inventory placement, and supply chains. Mapping customers or store locations within counties or states allows for more efficient operations and reduced costs.

Support Data-Driven Decision Making

Mapline turns geographic insights into actionable intelligence. Boundary maps provide context for trends and KPIs, enabling leadership to make strategic, informed decisions with confidence.

Location intelligence software: Drive smarter decisions with Mapline
What is a county boundary map used for?

County boundary maps help visualize local divisions that influence logistics, resource allocation, and performance metrics. They’re especially valuable for sales, service, and operations teams managing regional coverage.

How do state maps differ from county maps?

State maps offer a higher-level perspective, ideal for analyzing broader trends, comparing performance across regions, or planning multi-state expansion. County maps focus on more localized operational data.

Can I create both county and state maps in Mapline?

Yes. Mapline includes both county and state boundary layers, allowing you to toggle between them—or view both simultaneously—to match your analysis needs.

What makes Mapline’s boundary maps different from GIS online tools?

Unlike traditional GIS platforms, Mapline offers boundary mapping that’s intuitive, fast, and business-focused. You don’t need GIS expertise to create professional, data-driven maps in minutes.

Can I include national parks or natural areas on my maps?

Absolutely. Mapline supports overlays for national parks, forests, and other natural boundaries—helping teams plan around protected or geographically complex areas.

CREATE A TERRITORY MAP WITH MAPLINE NOW!