ALGERIA DISTRICTS
- Territory Guide
- ALGERIA DISTRICTS
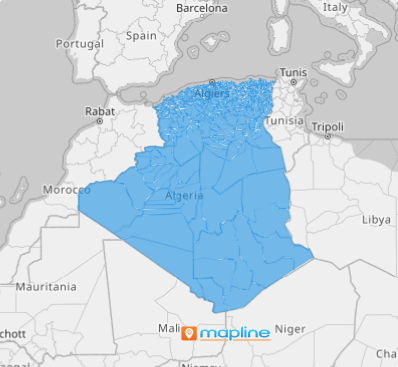
See the bigger picture with a territory map of Algeria districts! Imagine visualizing key insights across the region—sales figures and market trends transform into a strategic roadmap, guiding your next move with clarity and precision. It’s like getting a bird’s-eye view of your business—only better. Mapping Algeria’s districts brings your insights to life, revealing hidden patterns and unexpected opportunities. Gain a clearer perspective and make smarter, more strategic decisions with ease! Now that’s incredible insight!
Add Algeria districts to your map now and watch your analysis catalyze a remarkable transformation!
WHAT ARE ALGERIA DISTRICTS?
Known as the largest country in Africa, Algeria is a land brimming with potential across countless sectors. Nestled within its vast expanse are 547 districts, each offering unique opportunities waiting to be unlocked. Imagine laying these administrative divisions over your location on a map—what you get is a dynamic visualization that transforms raw numbers into actionable insights. It’s like turning on a spotlight in the dark corners of your business, revealing opportunities that spreadsheets alone can’t capture.
By leveraging a map of Algeria districts, you elevate your ability to analyze and respond to your business data, making your strategies not just smarter but incredibly effective.
ADD ALGERIA DISTRICTS
Let’s say you have a startup business and want to visualize market penetration and customer density to understand where your product or service is most popular. Adding Algeria districts to your map can make your data analysis simple yet powerful.
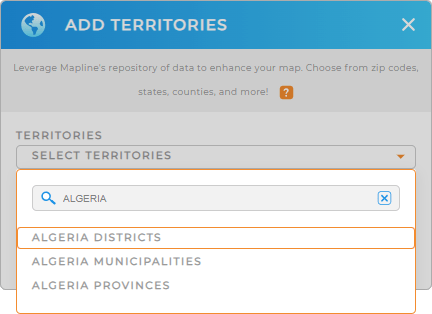
To achieve that, add a new territory from Mapline’s repository. Type ALGERIA into the search bar and select ALGERIA DISTRICTS.
One more step remaining and you can analyze your data on a district map.


Pro Tip: Mapline’s territory repository includes an extensive list of worldwide territory boundaries including Algeria districts, Algeria municipalities, and Algeria provinces. Analyze regional data comprehensively as you leverage adding various regions to your map, unlocking fresh insights for business continuity and success.
CHOOSE DISTRICT COLORS
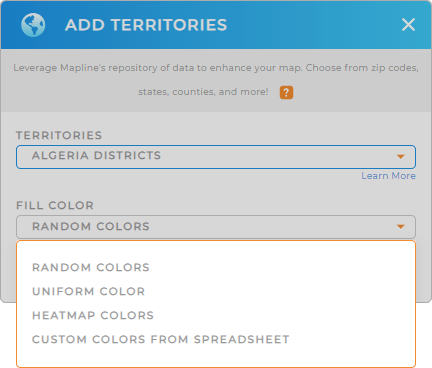
The last step is to fill your territory with colors. Applying colors to district boundaries is an essential step for clear and quick data visualization. You can achieve different levels of analysis with different color styles. For example, static colors can be applied if you want the districts to be more distinguishable. Dynamic colors can be applied if you want the colors tied with your data. This helps to quickly identify regional trends.
Select the type of colors that matches your analysis from the drop-down menu. Then click OK to start utilizing your map of Algeria districts.

GET NEW TERRITORY INSIGHTS
Leverage Mapline’s powerful mapping capabilities when analyzing your data on a territory map:
- Add competitor locations using connectors to make competitor analysis and develop strategic responses
- Run calculations from your data and achieve actionable insights from your territory data
- Identify areas of opportunities when you visualize data density across districts


