
Malawi Region Map for Enhanced Communication
A Region-Level Map Leads to Better Health Understanding
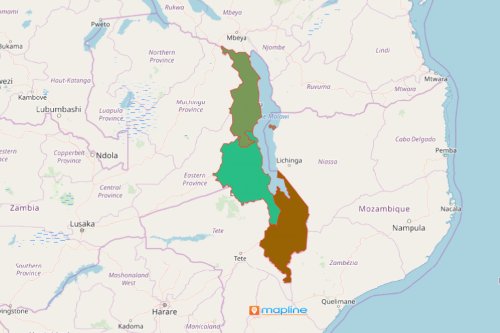
Health service organizations benefit from the insights gained by looking at a Malawi region map. Malawi is an African country divided into 3 regions. A map with regional boundaries emphasizes the coverage gaps of the target population. Analyzing data by region helps organizations to plan for unforeseen events. A region map with Excel spreadsheet locations leads to discovery of insights that are needed for improved health outcomes and healthier regional communities.
A region map helps government agencies to evaluate the scope of the health crisis brought about by the pandemic in individual regions. Sharing maps or embedding them on a website leads to a more efficient way of communicating to different government agencies.
Strengthen Public Health Awareness by Creating a Malawi Region Map
Because location is vital to planning and response, it is highly recommended to create a map that shows data layers of locations along with an overlay of region boundaries.
- Create a Mapline account and login.
- Click the orange “Add New Items” button.
- Select “New Map” on the drop down arrow.
- Give your map a name and click “OK.”
- Click the “Add” button from the left sidebar.
- Select the “Territories” option.
- Click “From Mapline’s Repository.”
- From the “Territories” select “Malawi Regions.” Use the search bar for quicker results.
- Select how you want your boundaries to be colored in “Fill Color” (Random Colors, Uniform Color, Dynamic heat map colors, or Custom colors from spreadsheet).
- Click “OK.”
True, in these critical times, communication is truly essential. Sign up now and learn to use more mapping tools for data analysis as you strengthen your communication with members of your team or with other organizations.