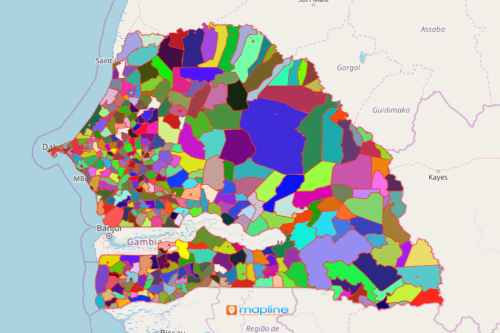
How to Use a Commune Map of Senegal to Improve Recycling Program
Make Your Territory Map Work For You
A commune map of Senegal is proven to be a very useful tool for the Solid Waste Management Coordination Unit for educating the public about the benefits of recycling plastics. The Senegalese government is serious in its drive to reduce the use of plastics, even passing a law about it in 2015. Sadly though, last year alone, out of 200,000 tons of plastic wastes produced, only 9,000 tons were recycled. Most of the rest were found dumped in the oceans. The result is heart-breaking. Marine biodiversity is suffocated which translates into less production of fish. The lesser the production, the worse for the economy.
Since economy and environment are correlated, public outreach and education is essential. Different agencies plot their data and map Senegal communes to understand what their data truly implies. A few clicks more and they can segment or filter their data to locate and identify non-conforming residents within a certain commune. From there, they can create plans to notify residents and educate them about the benefits of recycling. Through Mapline’s Automate, they can build schedules for truck drivers to pick up waste materials for recycling. Each truck driver can be assigned to a group of communes. They can access the right driving distance from one commune to another for a more organized and seamless process of collecting recyclable materials.

Data Insights Captured on a Territory Map
Use the commune map of Senegal to work to your advantage. Never miss an insight as you plot Excel spreadsheet data on your territory map.
- Create a Mapline account and login.
- Click the orange “Add New Items” button.
- Select “New Map” on the drop down arrow.
- Give your map a name and click “OK.”
- Click the “Add” button from the left sidebar.
- Select the “Territories” option.
- Click “From Mapline’s Repository.”
- From the “Territories” select “Senegal Communes.” Use the search bar for quicker result.
- Select how you want your boundaries to be colored in “Fill Color” (Random Colors, Uniform Color, Dynamic heat map colors, or Custom colors from spreadsheet).
- Click “OK.”
There are a lot more analytical tools that you can apply as you dig deeper analysis on a commune map of Senegal. Sign up now and learn how mapping helps in improving recycling programs.


