
Mapping Iraq Governorates – A Better Way to Implement Data
Governorate-Level Map for a Comprehensive Understanding of Oil Industry
A lot of companies and organizations in the oil industry are mapping Iraq governorates. A territory map of governorate boundaries is an important tool to help analyze data. In an industry with loads of locations, it is easy to just be lost in the web of data. However, with proper mapping tools, location data can be easily understood. When plotted on a map, Excel spreadsheet data can be a powerful data visualization. It significantly helps to analyze conflicting data. In addition, maps with territory boundaries are often used in transporting and marketing of petroleum products.
The right mapping tools are beneficial to improve business operations. It is also helpful in optimizing deliveries. A governorate-centric map allows the users to be focused on concentrated areas where the business operates. Moreover, it identifies untapped potentials and find new markets.
Governorate Map as a Robust Mapping Tool
Build a map with territory boundaries to find clusters of potential markets. Start by following these steps:
- Create a Mapline account and login.
- Click the orange “Add New Items” button.
- Select “New Map” on the drop down arrow.
- Give your map a name and click “OK.”
- Click the “Add” button from the left sidebar.
- Select the “Territories” option.
- Click “From Mapline’s Repository.”
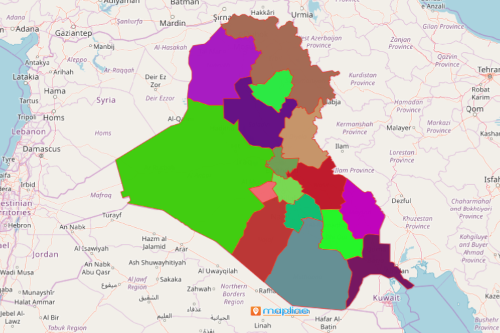
- From the “Territories” select “Iraq Governorates.” Use the search bar for quicker results.
- Select how you want your boundaries to be colored in “Fill Color” (Random Colors, Uniform Color, or Custom Colors From Spreadsheet).
- Click “OK.”
Do away with exhausting data analysis that takes hours and days. Instead, work with Mapline tools for a better way to implement data. Sign up now to make data competitive analysis in just a few clicks!