
Mapping Counties of North Korea For Public Health Preparedness
County-Level Map For A More Focused Approach in Health Preparedness
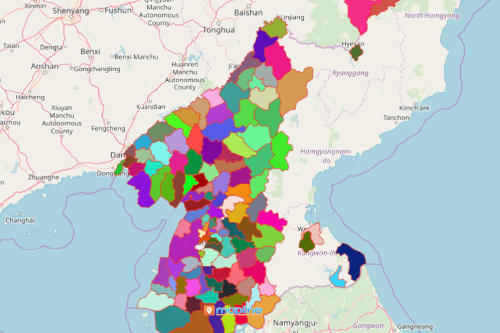
Since location data is highly important to planning, mapping counties of North Korea is an important step into planning a health preparedness program. Maps containing location data are proven useful to health department offices. However, when a map has an overlay of territory boundary, it reaches a whole new extent of data analysis! The relationships between locations and territory borders brings helpful insights into decision making. For instance, from a county map, the users can easily monitor the spread of virus per county.
More mapping tools are proven invaluable for health preparedness. For example, there’s the route optimization tool. It is often used to monitor resource allocation. On the other hand, a heat map is a trusted mapping aid to monitor the extent of public health crisis on a county level.
Building a Healthy Community
Building a map takes only less than a minute. A map with a county boundary is the first step of building a better and healthier community.
- Create a Mapline account and login.
- Click the orange “Add New Items” button.
- Select “New Map” on the drop down arrow.
- Give your map a name and click “OK.”
- Click the “Add” button from the left sidebar.
- Select the “Territories” option.
- Click “From Mapline’s Repository.”
- From the “Territories” select “North Korea Counties.” You can also enter that on the search bar.
- Select how you want your boundaries to be colored in “Fill Color” (Random Colors, Uniform Color, Dynamic heat map colors, or Custom colors from spreadsheet).
- Click “OK.”
When looking for a solution for public health crisis, you can never go wrong with mapping territory boundaries with location data. Sign up now to learn more mapping approaches for public health preparedness.