
User-Friendly Analytics to Enhance Mapping Districts of South Korea
Experience Data Interaction with District-Level Mapping Like no Other!
To help some organizations narrow down possibilities and choices, they lean on mapping districts of South Korea. By doing so, they can make informed decisions from the insights that they gathered. South Korea is a developed country that comfortably sits in the East of Asia. A map with an overlay of all the country’s district boundaries helps to uncover connections between data locations. It also shows the potentials of each district boundary.
Using other mapping tools further unearth more insights for decision-making. If you are looking for ways to uncover insights from data interaction, you may want to use the distance analysis and network coverage overlays. The distance calculator allows you to find the smartest ways to cut costs and increase profits. Meanwhile, with the network coverage overlays, the map instantly show the radius circles around your map pins. This helps to identify gaps in data and location for growth opportunities.
Easy Steps to Map District Boundaries
What are you waiting for? Jump right in to create a map of district boundaries:
- Create a Mapline account and login.
- Click the orange “Add New Items” button.
- Select “New Map” on the drop down arrow.
- Give your map a name and click “OK.”
- Click the “Add” button from the left sidebar.
- Select the “Territories” option.
- Click “From Mapline’s Repository.”
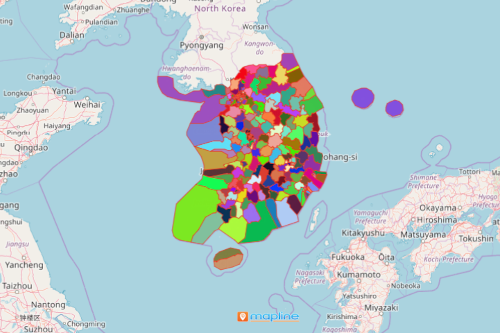
- From the “Territories” select “South Korea Districts (2019).” You can also enter that on the search bar.
- Select how you want your boundaries to be colored in “Fill Color” (Random Colors, Uniform Color, Dynamic heat map colors, or Custom colors from spreadsheet).
- Click “OK.”
Sign up now and see your data in a whole new way! Learn more about other powerful mapping tools to help you deepen your data understanding.