BELGIUM ARRONDISSEMENTS
- Territory Guide
- BELGIUM ARRONDISSEMENTS
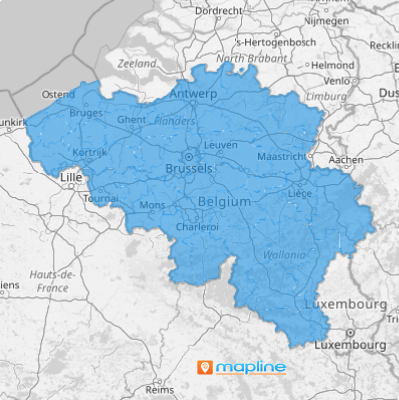
Boost your analytics by leveraging a map of Belgium arrondissements! These compact, detailed boundaries offer a granular view that transforms your data into a powerful strategic tool. By incorporating arrondissements into your analysis, you unlock a new level of insight into local market dynamics. Imagine the power within you as you gain and apply those insights to optimize your sales territories, leading to better performance and higher profitability!
Harness the power of these detailed boundaries to optimize your approach, boost performance, and drive profitability to new heights!
WHAT ARE BELGIUM ARRONDISSEMENTS?
Belgium’s 43 arrondissements are the crucial administrative subdivisions that lie beneath the province boundaries, each offering a finer level of detail. By integrating arrondissement boundaries into your analytics, you elevate your business planning, analysis, and marketing strategies to a whole new level. This powerful visualization allows you to pinpoint emerging markets with unprecedented clarity. With spatial analysis at your disposal, you can refine your planning, optimize territory management, and enhance your marketing.
Gain actionable insights to pinpoint market trends, analyze custom behavior, spot regions with strong competition, and develop strategies to gain market share!
ADD BELGIUM ARRONDISSEMENTS
Supercharge your analytics by leveraging a map of Belgium’s arrondissements! Make a competitor analysis on each arrondissement and adjust your strategies to put your business on top of the curve!
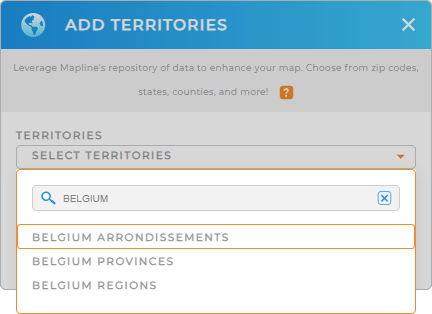
To do that, add a new territory from Mapline’s repository. Type BELGIUM into the search bar to trim down the selections, then select BELGIUM ARRONDISSEMENTS.
Now that you’ve got the right territory, let’s put some colors into your map.


Pro Tip: Leverage Mapline’s extensive territory repository to explore Belgium boundaries including Belgium provinces, Belgium regions, and arrondissements to gather more profound insights for informed decision-making.
CHOOSE ARRONDISSEMENT COLORS
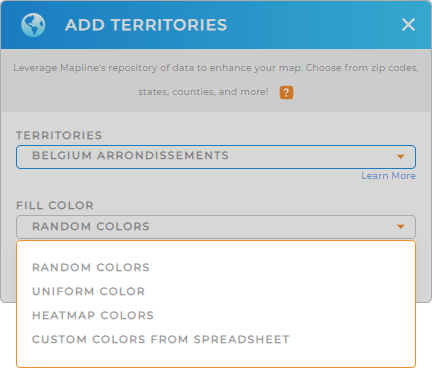
Turn your map of Belgium arrondissements into engaging visualization by applying color styles. A color-coded territory helps you quickly identify demographic trends and regional patterns at a glance leading to a more refined decision-making process. For example, you can apply gradient colors to show the intensity or concentration of your data in arrondissement areas. Fill your territory colors with more selections to choose from!
To customize your map, choose the color styling that match your type of analysis.
Lastly, click OK to finalize your selection.

GET NEW TERRITORY INSIGHTS
Unlock new insights with your map of Belgium arrondissements using these capabilities:
- Quickly merge territories to find the best fit for your team
- Seamlessly pull data from your favorite platforms like Salesforce, Google Sheets directly into Mapline
- Segment data to identify areas prone to challenges and craft proactive measures to eliminate them


