CANADA CENSUS METROPOLITAN AREAS
- Territory Guide
- CANADA CENSUS METROPOLITAN AREAS
Unlock the power of geographic insights with Mapline’s feature to add Canada Census Metropolitan Areas (CMAs) to your maps. CMAs represent densely-populated urban regions, providing businesses with invaluable insights for strategic decision-making.
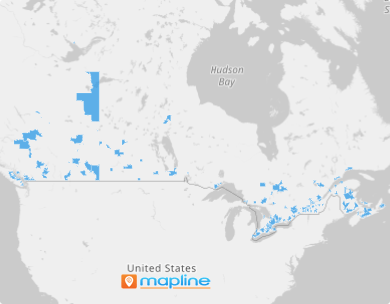
By visualizing CMAs on a map, you can identify prime locations for expansion, target marketing campaigns more effectively, and understand regional variations in consumer behavior. Whether optimizing distribution networks or analyzing market penetration, integrating CMAs into your maps can drive smarter business strategies and unlock new growth opportunities. Here’s how it works!
WHAT ARE CANADA CENSUS METROPOLITAN AREAS (CMAs)?
Canada census metropolitan areas (CMAs) are urban areas with a significant population core and adjacent municipalities that exhibit strong social and economic ties. A CMA must have one more more neighboring municipalities around a population center, and they must have a total population of at least 100,000– with at least half that population living within the core population center.
These boundaries offer a powerful opportunity for businesses to tap into ideal markets and increase sales. For example, sales and marketing teams can leverage CMAs to capitalize on a concentration of potential customers, driving sales and market expansion strategies. By incorporating CMAs boundaries into their maps, businesses can gain valuable insights that drive strategic decision-making and increase ROI.
ADD CMAs TO MAP
Now, with just a few clicks, you can use this territory boundary to run analytics or segment your location data. When dealing with hundreds or thousands of locations, you need to be able to respond quickly if something happens. And that’s where CMAs come in handy!
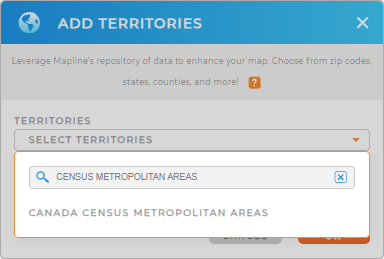
First, add a new territory from Mapline’s repository, then type CENSUS METRO into the searchbar. Select CANADA CENSUS METROPOLITAN AREAS and you’re good to go!


Pro Tip: Leverage Mapline’s vast, worldwide repository to add other Canada territories to your map! Play around with Canada population centers, Canada agricultural regions, or Canada census tracts to see which areas give you the best insights.
CHOOSE CMA COLORS
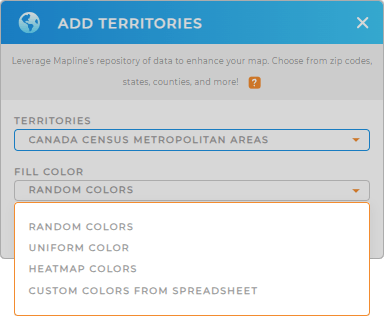
Intensify your analysis as you add colors to your territories. Color-coded territories help you hone in on key insights, patterns, and customer behaviors.
Just select the type of colors you need and click OK. You just empowered faster territory analysis and strategic decision-making for your brand!
How cool is that?

GET NEW TERRITORY INSIGHTS
But it doesn’t stop there! Your map is now an analytics powerhouse that when it comes to territory analysis. Tap into other map capabilities to get the most from your map:
- Set up an automated system that matches the right vehicle to the right service tech and job
- Map your locations to identify opportunities or customer patterns
- Embed a map that auto-updates with event information


