EQUATORIAL GUINEA REGIONS
- Territory Guide
- EQUATORIAL GUINEA REGIONS
Maximize your regional insights by mapping Equatorial Guinea regions. Visualizing these regional boundaries reveals critical geographic patterns and regional trends that influence your business operations, marketing strategies, and logistical planning. Mapline’s powerful territory visualizations help your team create and manage effective, location-specific sales territories.
Mapping Equatorial Guinea’s regions enhances business analytics, enabling you to identify new opportunities, optimize resource allocation, and improve market reach. Use these insights to stay ahead in a competitive market landscape.
WHAT ARE EQUATORIAL GUINEA REGIONS?
Equatorial Guinea is divided into several regions, each with distinct demographic and economic profiles. These regions are essential for understanding local market conditions, planning resources, and targeting customers effectively.
Businesses can leverage region-level data to refine marketing strategies, streamline supply chains, and improve customer service. Mapping these regions offers a clear view of regional strengths and opportunities, aiding in better decision-making.
ADD REGIONS TO MAP
Integrating Equatorial Guinea’s regional boundaries into your map allows for detailed analysis and strategic planning. This visual aid supports informed decision-making and enhances operational efficiency.
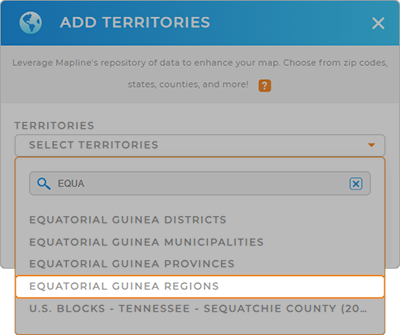
First, add a new territory from Mapline’s repository. Type EQUATORIAL into the searchbar and select EQUATORIAL GUINEA REGIONS.
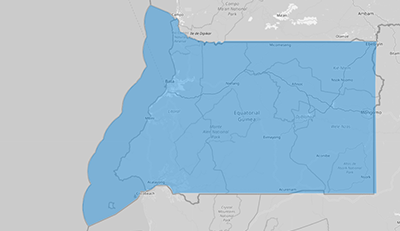
And Boom! You’re halfway there to generating a comprehensive map that helps you understand your audience on a regional level.


Pro Tip: Tap into Mapline’s worldwide territory repository to map other regions. Compare and contrast the administrative boundaries of Equatorial Guinea provinces, regions, Equatorial Guinea districts, and Equatorial Guinea municipalities. Learn how local boundaries impact your brand.
CHOOSE REGION COLORS
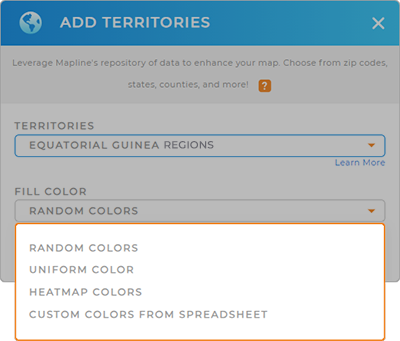
Tap into the power of color-coding and level-up your analytics! Adding colors to Equatorial Guinea’s regions empowers you to quickly identify trends and market shifts so you can pivot in the moment.
Select your desired color styling, click OK, and that’s all there is to it!
There’s no more powerful way to visualize your data so you can analyze at the speed of light.

GET NEW TERRITORY INSIGHTS
Unlock deeper insights with Mapline’s advanced capabilities:
- Draw custom shapes on your map to visualize service coverage or areas of interest
- Tie your business locations to your sales data to create an interactive map that updates in real-time
- Customize which data is displayed when you hover or click on your customers and locations


