
Belarus District Map Helps Uncover Relationships in Data
Uncover Hidden Insights in a District-Level Map
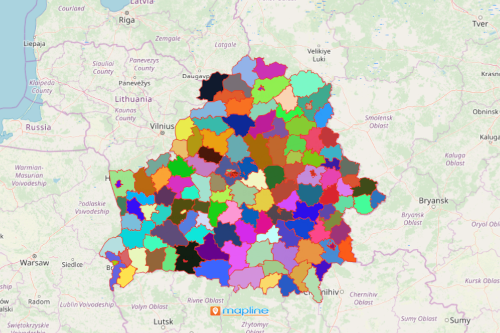
Data analysts and economic developers all rely on the use of Belarus district map for a deeper level of data analysis. Belarus is a country located in Eastern Europe. It is divided into 118 districts. The map showing an Excel spreadsheet data with an overlay of district boundaries provides a clear overview of potentials for development for each district. The territory boundaries promote a sharp visual to identify connections between data and their boundaries. On the map, you can uncover hidden potentials of each district. Additionally, some spatial insights may be present from a group of district boundaries. Thus, a district map is a clear visualization for planning ahead.
Mapline has a lot of advanced business intelligence tools in store for you. Using these tools will help your organizations to tap new patterns. In turn, these patterns are vital for decision making in business development, marketing, sales, logistics, risk management, and more! For example, heat maps show location density. This is an effective tool to understand which areas generate more sales as compared to areas that perform the least.
The Easiest Way to Build a District Map
Uncomplicate your district-level map building by following these 10 easy steps:
- Create a Mapline account and login.
- Click the orange “Add New Items” button.
- Select “New Map” on the drop down arrow.
- Give your map a name and click “OK.”
- Click the “Add” button from the left sidebar.
- Select the “Territories” option.
- Click “From Mapline’s Repository.”
- From the “Territories” select “Belarus Districts.” You can also enter that on the search bar.
- Select how you want your boundaries to be colored in “Fill Color” (Random Colors, Uniform Color, Dynamic heat map colors, or Custom colors from spreadsheet).
- Click “OK.”
Understanding the geographical boundaries of each district means understanding how your business grows. Sign up now and experience the benefits of using advanced mapping tools to uncover data relationships.