
Create a Czech Republic Oblasts Map Now!
Czech Republic Oblasts Territory Boundary Available to Map
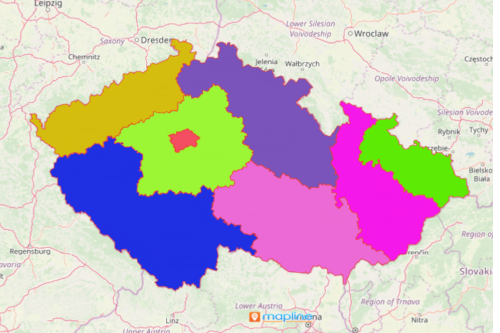
Aside from regions and districts, Mapline also offers another unique territory boundary for Czech Republic: Oblasts. Now, overlaying different territory boundaries of Czech Republic makes it more possible for enhanced data analysis and visualization. When Excel data is added on a map of oblast boundaries, there are significant patterns and location insights that can be tapped. These insights are like gems that can be discovered the more in depth the analysis is.
To improve mapping efficiency, Mapline is able to help to make the best of your time. Supersets is the best option to help you set up an automated platform which updates based on every change you make from your data. The result? Your time will be more focused on how you execute actionable insights.
10 Easy Steps to Create a Map of Czech Republic Oblasts
If you think that overlaying a territory boundary of Czech Republic is difficult, think otherwise! In the next few seconds, you will be amazed just how easy it is to build a map of Oblast boundaries:
- Create a Mapline account and login.
- Click the orange “Add New Items” button.
- Select “New Map” on the drop down arrow.
- Give your map a name and click “OK.”
- Click the “Add” button from the left sidebar.
- Select the “Territories” option.
- Click “From Mapline’s Repository.”
- From the “Territories” select “Czech Republic Oblasts.” You can also enter that on the search bar.
- Select how you want your boundaries to be colored in “Fill Color” (Random Colors, Uniform Color, Dynamic heat map colors, or Custom colors from spreadsheet).
- Click “OK.”
Sign up now to discover not only the hidden relationships between location data but spatial insights as well.