
Enable Better Planning With Finland Municipality Map
Municipality Map as Location-Based Tool for Data Analysis
A Finland Municipality map furthers multiple goals. Such goals include improved health awareness, creating equitable incomes, and community development. Collaboration between government departments through mapping is vital in different levels. It is a tool used by local government offices to administer their programs such as public safety and health in times of the pandemic. In the same way, maps with municipality boundaries are also used to foresee efforts to reopen the economy. In this way, map as a data analytic tool strengthens the collaboration between government agencies and community groups.
Additionally, a municipality-level data analysis is a smart approach to monitor the reopening of the economy. When each boundary of municipality is seen on a map, it leads to better understanding of emerging concerns and what actions should be taken. More than that, sharing maps or embedding them on a website implements a data-driven system to which program leaders and facilitators can access the data and implement activities and programs successfully.
Municipality Map: The Center of Planning for Economic Re-Opening
Create a map in less than one minute! Once you have your Finland municipality map, you can start your analysis right away.
- Create a Mapline account and login.
- Click the orange “Add New Items” button.
- Select “New Map” on the drop down arrow.
- Give your map a name and click “OK.”
- Click the “Add” button from the left sidebar.
- Select the “Territories” option.
- Click “From Mapline’s Repository.”
- From the “Territories” select “Finland Municipalities.” You can also enter that on the search bar.
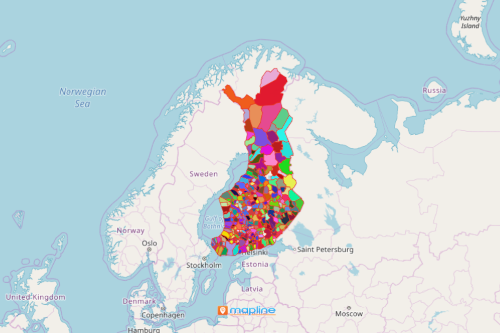
- Select how you want your boundaries to be colored in “Fill Color” (Random Colors, Uniform Color, Dynamic heat map colors, or Custom colors from spreadsheet).
- Click “OK.”
Use more powerful mapping tools to analyze, assess emerging trends, or discuss impacts of the pandemic in re-opening businesses. Sign up now to further your data analysis through mapping.