
Luxembourg Commune Map Helps Identify Customer Pain Points
Find Tailor-Fit Solutions by Mapping Commune Boundaries
Many businesses today find that creating a Luxembourg commune map is a big help in their data analysis. Luxembourg is a landlocked country situated in the heart of Western Europe. Because of its location and its stable and high-income market economy, a lot of big international companies find the country as their new home. However, even in a wealthy country with rich economy, running a business presents many challenges. For instance, there are customer pain points that need to be addressed. Mapping the territory boundaries such as Luxembourg communes is one way to identify the pain points of potential customers. How? For one, maps present a powerful data visualization that tell connections between locations. A commune boundary coupled with Excel spreadsheet location data of store outlets, competitors, and customers when plotted on a map, reveals ideas for serious consideration.
Overlaying territory boundaries helps to identify customers’ needs. Territory mapping reveals significant information that may be too easy to ignore just by looking at rows and columns of spreadsheets. Just by looking at the different data layers that are plotted on a map allows the users to find patterns and identify the customer pain points. Territory mapping also reveals the customers’ buying needs. In line with this, customers living in one commune may have totally different buying needs than customers who are living in another commune. That is why Mapline provides a powerful mapping tool called draw pad. It helps the users customize the map by adding shapes as a territory for tailor-fit data analysis. This is helpful in further studying the buying patterns of the customers.
Pinpoint the Pain Points Through Mapping
These easy steps will help you get started with mapping. Then start your data analysis right away.
- Create a Mapline account and login.
- Click the orange “Add New Items” button.
- Select “New Map” on the drop down arrow.
- Give your map a name and click “OK.”
- Click the “Add” button from the left sidebar.
- Select the “Territories” option.
- Click “From Mapline’s Repository.”
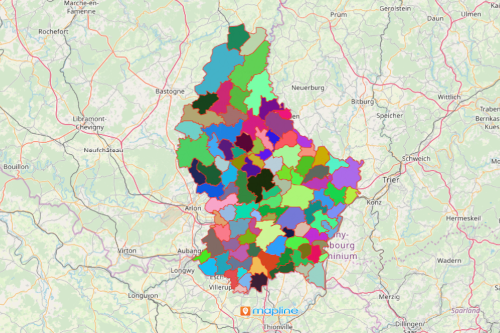
- From the “Territories” select “Luxembourg Communes.” You can also enter that on the search bar.
- Select how you want your boundaries to be colored in “Fill Color” (Random Colors, Uniform Color, Dynamic heat map colors, or Custom colors from spreadsheet).
- Click “OK.”
Mapping is proved to be a clutter-free way of data analysis. Sign up now to know more options to use to better understand your customer pain points.