
Step Up your Data Analysis with a Map of Municipalities of Spain
Trim Down Excessive Amount of Data Analysis with a Powerful Territory Map
In recent years, there is an upward trend of the number of organizations that use a map of municipalities of Spain. The reasons are endless! For one, using a map of Excel data with municipality boundaries helps speed up data analysis. Since time is of the essence, it is very crucial to every organization to make fast and accurate analysis to spend more time in actual planning and application. As we live in an innovative world, gone are the days where analysis uses only spreadsheets, documents and charts. Do away with daunting and cumbersome analysis by putting your Excel data on a municipality map. The result may be more powerful than what you expect!
An exceptional tool that Mapline offers is the supersets. By applying this on a map, you can do away with formatting and updating spreadsheets every so often. What you can do is just to paste your raw data and leave the calculations to Mapline. This enables you to focus more on what really matters to your organization like discovering insights or driving business success.
Step Up Your Game in Data Analysis with a Municipality Map
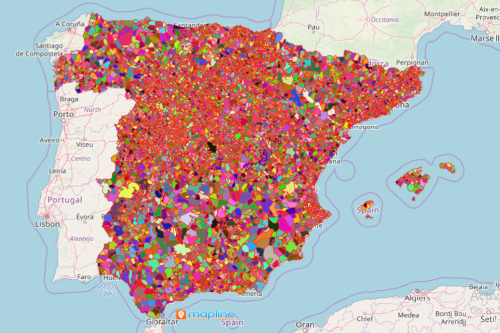
Waste no time at all as you create a map of Spain municipalities. Why? Because it only takes a matter of seconds to overlay more than 8,000 municipality boundaries of Spain:
- Create a Mapline account and login.
- Click the orange “Add New Items” button.
- Select “New Map” on the drop down arrow.
- Give your map a name and click “OK.”
- Click the “Add” button from the left sidebar.
- Select the “Territories” option.
- Click “From Mapline’s Repository.”
- From the “Territories” select “Spain Municipalities (2019).” You can also enter that on the search bar.
- Select how you want your boundaries to be colored in “Fill Color” (Random Colors, Uniform Color, Dynamic heat map colors, or Custom colors from spreadsheet).
- Click “OK.”
Sign up now and start being acquainted with other mapping tools to help speed up your data analysis.