LUXEMBOURG CANTONS
- Territory Guide
- LUXEMBOURG CANTONS
Supercharge your analytics by mapping Luxembourg cantons on your Mapline! Dive deep into the intricacies of consumer behaviors, refine your sales strategies, and tap into local market dynamics with precision. A canton-level map isn’t just a tool—it’s your secret weapon in navigating the competitive landscape and boosting your brand’s performance. Ready to unlock groundbreaking insights and transform your approach?
Let’s jump into action and tailor your canton map for maximum impact!
WHAT ARE LUXEMBOURG CANTONS?
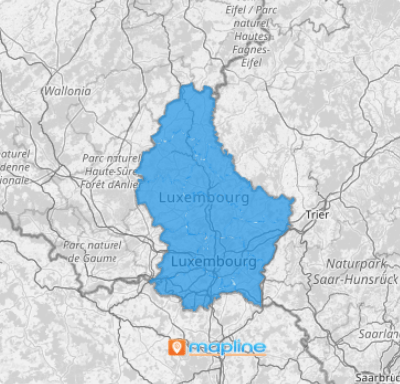
Strategically divided into 12 cantons, Luxembourg might not utilize these divisions for administrative functions, but they play a critical role in shaping electoral and judicial landscapes. This makes them invaluable for dissecting market potentials and planning your expansion with precision. Zoom into each canton on your map and discover untapped opportunities and areas ripe for your business growth.
By integrating a canton territory map into your analytics, you empower your team to visualize competitor landscapes and optimize sales routes effectively. Don’t just plan—strategize with the precision of a map of Luxembourg cantons. Begin now by mapping out the canton boundaries and set the stage for a data-driven success story!
ADD LUXEMBOURG CANTONS
With a clear visualization of canton boundaries, you can identify different opportunities that sharpen your decision-making. Leverage these insights to enhance customer engagement, site suitability, and market planning.
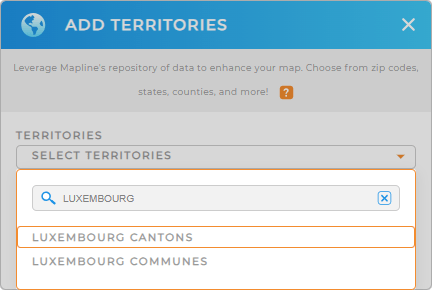
There are only two easy steps to add Luxembourg cantons to your map. First, add a new territory from Mapline’s repository. On the search bar, type LUXEMBOURG and select LUXEMBOURG CANTONS.
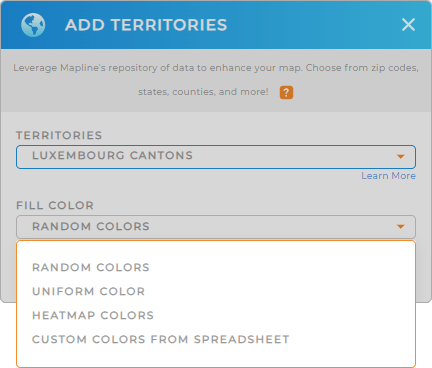
We’re done with the first step, now let’s move on to the last step and that is to fill colors for your territory.


Pro Tip: Easily consolidate regions from various countries into your map including Luxembourg communes and cantons from Mapline’s Repository of worldwide territory. Leveraging territory maps in your analysis significantly improves your data and location analyses.
CHOOSE CANTON COLORS
A color-coded map promotes visual differentiation to help you spot regional patterns instantly. By assigning colors to your canton territory, you can identify patterns and craft strategies to upgrade your business operations. For instance, choose heat map colors to identify potential risks and plan accordingly. How awesome is that?
Apply the color styles that’s a perfect fit for the type of analysis that you’re doing. Lastly, click OK.
By following these two easy steps, you can create and use a visually informative canton map that significantly enhances your data-driven decision-making!

GET NEW TERRITORY INSIGHTS
Apply these advanced capabilities and gather all valuable insights from your data analysis:
- Make data work for you when you customize your data
- Generate smart sales routes in seconds
- Analyze your data faster when you filter your data


