NEW ZEALAND STATISTICAL AREAS
- Territory Guide
- NEW ZEALAND STATISTICAL AREAS
Unlock the full potential of your strategy with a map of New Zealand’s statistical areas! Harnessing the power of statistical area-level visualization allows you to uncover unparalleled insights and craft marketing strategies that truly resonate. By tailoring your approach to the unique needs, behaviors, and preferences of each area, you go beyond simple marketing—you build authentic connections that drive loyalty and growth!
Let’s get these boundaries added to your map in seconds and take your strategy to new heights!
WHAT ARE NEW ZEALAND STATISTICAL AREAS?
New Zealand, a stunning island nation in the southwestern Pacific Ocean, is organized into statistical areas that reflect the diverse character of its landscapes—ranging from bustling urban centers to sprawling farmlands, untouched wilderness, and waterways.
Incorporating these boundaries into your mapping efforts provides a crystal-clear view of regional dynamics that directly influence your business. This clarity helps you build stronger customer connections, boost lead generation, and minimize costly delivery errors. By visualizing your data through these regional lenses, you can streamline operations, fine-tune marketing strategies, and uncover exciting growth opportunities—all while ensuring your efforts align with the unique characteristics of New Zealand’s communities.
ADD NEW ZEALAND STATISTICAL AREAS
Analyze different factors affecting your business within New Zealand’s statistical areas. Gain the clarity and confidence to make decisions that deliver exceptional results. This isn’t just smart marketing—it’s a game-changing approach that positions you as an industry leader!
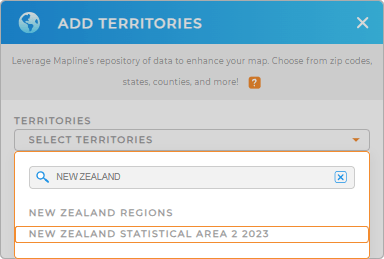
Add a new territory from Mapline’s Repository–it’s quick and seamless! Just type NEW ZEALAND in the search bar and choose NEW ZEALAND STATISTICAL AREAS.
We’re done with the first step. We’re sure you’ll love the next step–applying your map colors.


Pro Tip: Tap into the power of Mapline’s global territory repository to provide you with global territories, including New Zealand regions and statistical areas. Leverage our repository to map different regions of interest and gain deeper insights for strategic planning.
CHOOSE STATISTICAL AREA COLORS
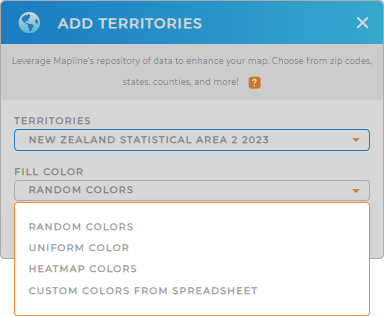
A color-coded territory map isn’t just visually striking—it’s a game-changer for your decision-making process. By assigning distinct colors to your territories, you can instantly spot patterns, trends, and factors impacting your business at a glance. Say goodbye to lengthy analysis and hello to insights in half the time!
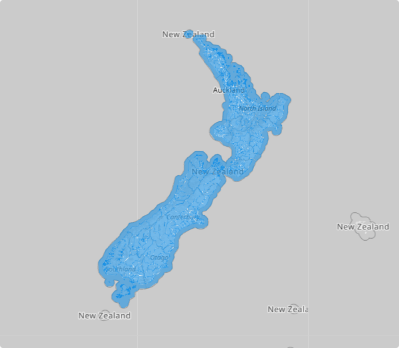
Choose your preferred color styles then click OK. Now watch your map transform into a powerful tool for enhanced analysis.

GET NEW TERRITORY INSIGHTS
Unlock additional insights by leveraging these Mapline capabilities:
- Break up your customer base with customer segmentation
- Combine different types of data visualizations to create a dashboard
- Quickly draw custom territories for in-depth location analysis


