
Data Analysis in Minimal Time with Mexico Municipality Map
More Focused Data Analysis in Municipality-Level Mapping
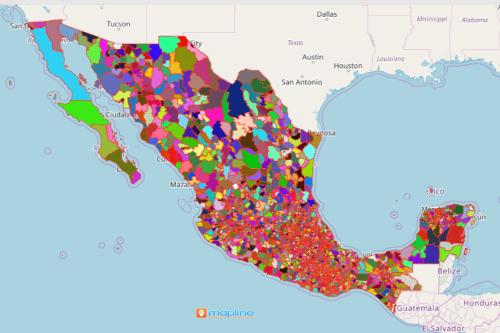
A focused study on a Mexico municipality map reveals patterns valuable to the decision-making process. Mexico is the 13th largest country in the world. It is located in the southern portion of North America. The country is divided into 2,454 municipalities. An Excel data map with an overlay of municipality boundaries is used by many sectors including business, local government units, and researchers to find the population within each municipality. With Mapline, you can get population data based on municipality criteria in seconds!
A municipality map can be used for target market analysis. If you want to target a particular group of people, try using demographic analysis map tool or data segmentation to find your target market in less than a minute. The tools are specifically designed to create powerful data visualization so you can spend more time on marketing strategy and execution.
Just a Few Clicks Away in Building Your Mexico Municipality Map
A few seconds is all you need to create a map with an overlay of all the municipalities of Mexico. The quick map creation time is designed to allow you to spend more time on data analysis. So better start mapping now:
- Create a Mapline account and login.
- Click the orange “Add New Items” button.
- Select “New Map” on the drop down arrow.
- Give your map a name and click “OK.”
- Click the “Add” button from the left sidebar.
- Select the “Territories” option.
- Click “From Mapline’s Repository.”
- From the “Territories” select “Mexico Municipalities 2019.” You can also enter that on the search bar.
- Select how you want your boundaries to be colored in “Fill Color” (Random Colors, Uniform Color, Dynamic heat map colors, or Custom colors from spreadsheet).
- Click “OK.”
Find ideal areas to combine your data with. Sign up now and take advantage of hundreds of territory boundaries that you can use to fully enjoy your mapping experience.