
Mapping Voting Districts in the US
A Focused Understanding of the Elections When Mapping Voting Districts in the US
Mapping voting districts in the US is instrumental for different purposes. But what exactly is a voting district? It is a geographical area used to group voters. Sometimes it is called an electoral district. There are four types of voting districts – Statewide, State Legislative, Congressional, and Local Government.
Normally, geographic boundaries such as county lines or city lines are grouped to form a voting district. However, most of the time, population is a factor when grouping the voting districts. For example, a typical urban voting district may have some 3,000 voters within 7.5 km radius of the voting station. On the other hand, a rural voting district has 1,200 voters within a 10 km radius of the voting station.
Heat mapping voting districts in the US is used by government offices during election time. But worry no more! With this boundary available in Mapline, you can create a map whenever, wherever!
Steps to Mapping Voting Districts in the US
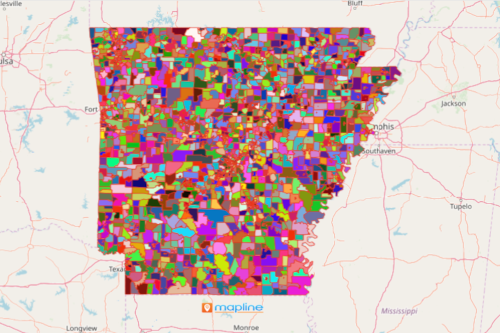
The voting district boundary is available for the following states: Arkansas, Florida, Washington, and Pennsylvania. Begin mapping now by following these steps:
- Create a Mapline account and login.
- Click the orange “Add New Items” button.
- Select “New Map” on the drop down arrow.
- Give your map a name and click “OK.”
- Click the “Add” button from the left sidebar.
- Select the “Territories” option.
- Click “From Mapline’s Repository.”
- From the “Territories” select “U.S. Voting Districts” and select the State of your choice. You can also enter that on the search bar.
- Select how you want your boundaries to be colored in “Fill Color” (Random Colors, Uniform Color, Dynamic heat map colors, or Custom colors from spreadsheet).
- Click “OK.”
Start a more organized data interaction when mapping voting districts in the US. Sign up now and take advantage of all the mapping benefits you can get.