
A Better Risk Management Planning Using a Peru District Map
District-Level Mapping for Increased Situational Awareness
Every local government office should be using a Peru district map to monitor their localities more effectively. Peru is a megadiverse country situated in South America. It is divided into 1,869 districts. Mapping Excel data with an overlay of district boundaries is necessary nowadays especially since the pandemic is still widespread and continues to affect us. A deep understanding of where the population is within specific boundaries is a sure way to plan risk management effectively. A district map with location data tells ideas about economic situations. It relays the needs that should be provided for the general public, as well as how supplies and services should be sent out in the most minimal time.
As planning is in progress, other available mapping tools can be used to help out with risk management. Network coverage tool is a popular tool used for risk mitigation planning. When applied on a map, it gives a powerful visual representation of your network. This is especially useful when dealing with thousands of locations and immediate action is demanded. In addition, heat maps proved to be indispensable to visualize the areas that are prone to more risks.
District Mapping as a Survival Tool for Risk Assessment
Here’s how to create a district-based map to respond better and operate more effectively:
- Create a Mapline account and login.
- Click the orange “Add New Items” button.
- Select “New Map” on the drop down arrow.
- Give your map a name and click “OK.”
- Click the “Add” button from the left sidebar.
- Select the “Territories” option.
- Click “From Mapline’s Repository.”
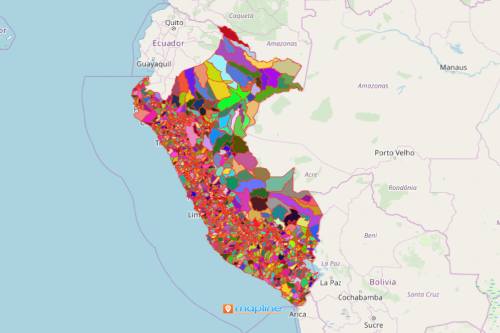
- From the “Territories” select “Peru Districts (2019).” You can also enter that on the search bar.
- Select how you want your boundaries to be colored in “Fill Color” (Random Colors, Uniform Color, Dynamic heat map colors, or Custom colors from spreadsheet).
- Click “OK.”
Sign up now and learn more about other powerful mapping tools that are within your reach as you aim to respond timely in times of crisis.