
Suriname District Map – Essential to Economic Development Planning
Enhance Economic Strategies Using a Map of Suriname Districts
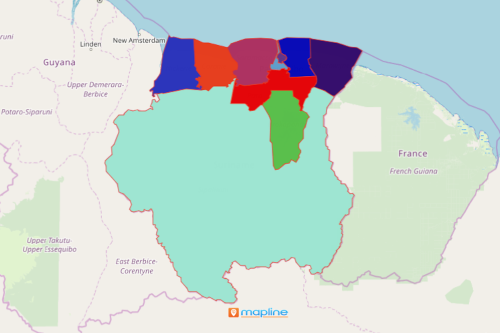
A Suriname district map is used by district commissioners. Suriname is a tropical country situated in South America. It is divided into 10 districts. Each district is managed by a district commissioner. Bauxite industry is one of the key economic factors in the country. Therefore, a district-level map is very useful when it comes to understanding the potential areas where minerals or agricultural resources can be developed. A district map serves as a guide to district commissioners to enhance economic strategies. Moreover, location data within district borders magnifies insights that are significant to economic development planning.
In addition, a district territory map is timely to use and can be shared in an instant. Sharing a map to the members of the planning committee solidifies proper communication. Additionally, the map can be embedded on a website to ensure collaboration and coordination between different commissioners’ offices.
Monitor Economic Progress Through a Suriname District Map
Visualize location data on a district-level map. Start mapping today by following these steps:
- Create a Mapline account and login.
- Click the orange “Add New Items” button.
- Select “New Map” on the drop down arrow.
- Give your map a name and click “OK.”
- Click the “Add” button from the left sidebar.
- Select the “Territories” option.
- Click “From Mapline’s Repository.”
- From the “Territories” select “Suriname Districts.” You can also enter that on the search bar.
- Select how you want your boundaries to be colored in “Fill Color” (Random Colors, Uniform Color, Dynamic heat map colors, or Custom colors from spreadsheet).
- Click “OK.”
Each district tells a spatial story that may be significant to economic growth. Sign up now and experience the use of powerful mapping tools for monitoring and planning for economic growth.