U.S. VOTING DISTRICTS
- Territory Guide
- U.S. VOTING DISTRICTS
Explore insights through a map of U.S. voting districts and you’ll uncover patterns that go far beyond politics—fueling smarter, more impactful decisions across the board. It can unlock powerful insights for businesses aiming to refine your strategies and connect with the right market. By utilizing Mapline to map these districts, you can identify key target markets, uncover consumer trends, and tailor marketing campaigns with precision. With this level of analysis, you can optimize outreach efforts, align strategies with regional needs, and connect with customers where it matters most. Mapping these special boundaries empowers you to make data-driven decisions that drive growth and strengthen your brand presence.
Ready to transform the way you approach strategic planning? Leverage the power of a voting district map and turn insights into actionable success!
WHAT ARE U.S. VOTING DISTRICTS?
Voting districts are often shaped by geographic boundaries like county or city lines, but population plays a pivotal role in their design. This ensures fair representation by balancing the number of voters across districts. For instance, in urban areas, a typical voting district might encompass 3,000 voters within a 7.5 km radius of a polling station. In contrast, rural voting districts usually cover a wider area, accommodating around 1,200 voters within a 10 km radius of their voting station. This thoughtful grouping ensures accessibility while addressing the unique population densities of urban and rural communities, striking a balance between convenience and fair representation.
These districts are not just lines on a map—they are the building blocks of democracy, determining who speaks for whom in government.
ADD U.S. VOTING DISTRICTS
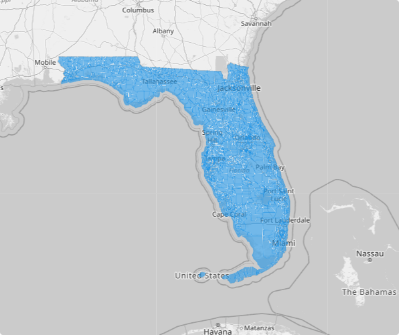
Integrate the voting district boundaries to your map and open the door to a world of untapped opportunities! These geographic boundaries aren’t just visual markers—they’re powerful tools that provide critical insights into market trends, and growth opportunities.
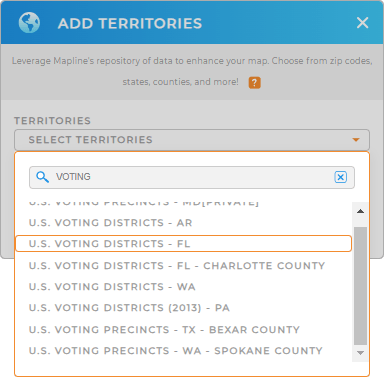
Start by adding a new territory from Mapline’s repository. Use the search bar to simplify the process. Just type VOTING to immediately trim down the selections. Then, choose U.S. VOTING DISTRICTS and choose your preferred state.


Pro Tip: Mapline’s repository offers voting district territories for states like Arkansas, Washington, Florida, Pennsylvania, and Texas. These local territories are invaluable for creating optimized delivery routes, streamlining resource allocation, and customizing services to meet community needs.
CHOOSE VOTING DISTRICT COLORS
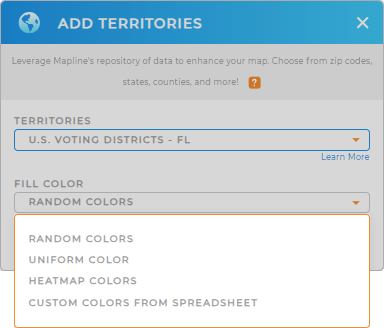
Colors are more than just visual aids—they’re a game-changer for your analytics. Mapline lets you use static colors to distinguish territories and make your data instantly readable, creating clarity at a glance. To truly supercharge your insights, you can also embrace dynamic colors that adapt to your data metrics in real-time.
Select the perfect type of colors to maximize your results with clear visualization through strategic color-coding!

GET NEW TERRITORY INSIGHTS
But it doesn’t stop there! With these powerful capabilities, you can enhance your analytics even more!
- Effortlessly create a sales chart of your historical sales, YTD sales, and projected sales
- Control which data you want to show to sort through your numbers in a few seconds
- Level up your analysis as you perform advanced data calculations


