CREATE INSTANT CUSTOMER + DELIVERY MAPS
- How To Guide
- CREATE INSTANT CUSTOMER + DELIVERY MAPS
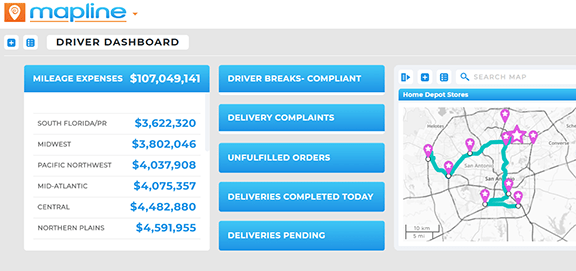
Easily generate detailed maps of customer locations and track deliveries in real time! Imagine effortlessly seeing all your customer locations and delivery routes at a glance, without the hassle of manual planning. Just import your data, and within minutes, you’ll have an interactive map displaying all of your delivery locations.
But it doesn’t stop there! Configure your map to auto-update every time a delivery is made so you can monitor everything in real-time.
Whenever a customer (or the boss!) wants to know where a delivery is, you’ll just click on their map pin and see the driver’s status, as well as delivery receipts, pictures, and a precise time and location stamp if the delivery has already been completed.
Now, that’s some powerful stuff! With a customer map like this, you can easily monitor delivery status and location, adapt to last-minute changes, and enhance efficiency— all without calling a single driver.
CREATE YOUR MAP
Here’s how to quickly generate a map of your customers and deliveries.
Start by adding pins from an existing dataset in Mapline.
Or, if you prefer to add pins from a spreadsheet, simply click the ADD menu on your map, hover over PINS and select FROM SPREADSHEET. Copy and paste your spreadsheet data, and you’re all set!
You’re done with the first step– now, let’s unleash the full potential of your new map.
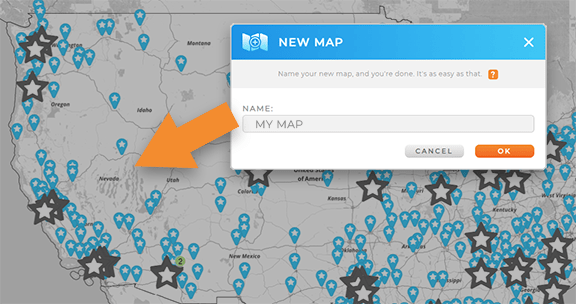

Pro Tip: Use your spreadsheets or existing datasets to import business locations, distribution centers, vehicle yards, or driver locations to your map. Leverage any spreadsheet or Mapline dataset to import vital information that helps you optimize logistics!
CUSTOMIZE YOUR MAP
Your map becomes powerful when you leverage your data to create visuals for real-time monitoring. One highly effective method is to segment your pins according to your data. This way, you can quickly assess delivery status at a glance.
To accomplish this, you’ll need to ensure your data is configured correctly. Let’s quickly review what your dataset needs to track deliveries in real-time:
CONFIGURE YOUR DATASET
To link your pin colors to your data, first ensure your dataset contains the precise information you want to visualize on your map.
If you already have a column in your dataset indicating delivery status, you can skip to the next step.
If not, right-click your map pin layer and select VIEW DATA to open the dataset from which your pin data is derived.
Next, we’ll add a new column. Just right-click any column and select INSERT LEFT or INSERT RIGHT. (The placement of this column can easily be adjusted later).
Now, name your new column DELIVERY STATUS or a similar identifier, and you’re good to go.
If you don’t have current delivery status data, don’t sweat it– in just a minute, we’ll learn how to automatically collect this data and eliminate the need for manual input. But first, let’s quickly finish customizing your map.
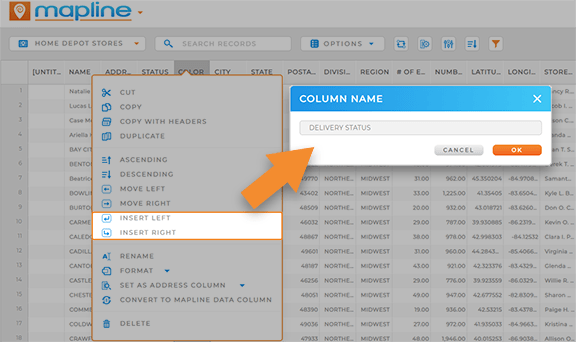

Pro Tip: When you click VIEW DATA to open your dataset, you’re directly editing the dataset itself. Any modifications you make here will be mirrored in the original dataset and any visualizations (maps, charts, etc.) that depend on that dataset.
SEGMENT YOUR MAP PINS
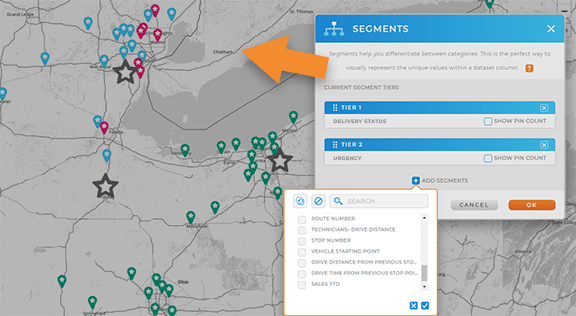
Now that your dataset is ready, let’s navigate to the sidebar on the left-hand side of your screen. Right-click the pin layer folder you’d like to customize, then select SEGMENT.
Next, click ADD SEGMENTS and select the DELIVERY STATUS column you just created.
If there are additional segments you’d like to see, such as late or delayed deliveries, you can add additional tiers here.
When you’re finished segmenting, click OK. And that’s it! Your map pins are now tied to your data. Any time your data changes, the pins auto-update, giving you an accurate snapshot of your operations every time you open your map.
CONFIGURE AUTOMATIONS
If you thought we were done, buckle up. You don’t just want your map pins tied to your dataset– you want the data itself to update in real-time, all the time.
That’s right! You’re about to create a self-managing system that gives you the accurate, up-to-date insights you need, 24/7. Setting this up doesn’t take long, and once configured, you never have to worry about it again.
AUTOMATE DATA COLLECTION
Empower your drivers to submit real-time delivery data whenever they complete a delivery!
First, let’s create a form that collects vital delivery information from your drivers. Just click the Mapline logo at the top-left of your screen and select NEW FORM. From here, customize your form to gather specific data relevant to each delivery.
For instance, you may want to capture:
- Driver name
- Location name
- Location address
- Products delivered
- Invoice Number
- Latitude and Longitude of Delivery
- Pictures of Delivery
- Recipient Signature
- Precise Date and Time of Delivery
(If you’re already using a Mapline form that captures this data, skip ahead to the next step).
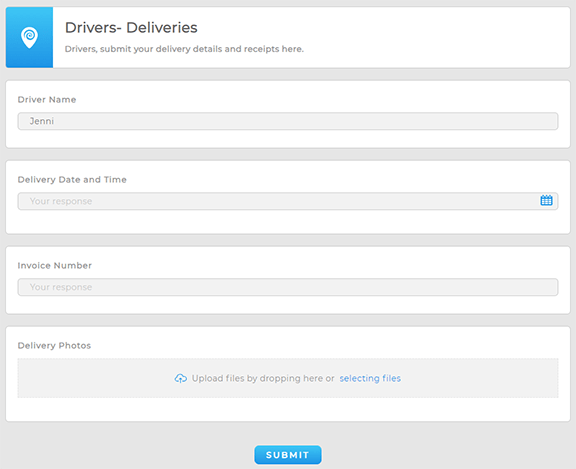
Some of this data can be automatically imported from your existing datasets so they auto-load when the driver arrives on-site (how cool is that!?). And rather than having your driver fill out dozens of questions with each delivery, you can easily capture meta-information with each form submission, allowing them to get right back on the road.
Lastly, customize your form submit settings to ensure that all of your form data auto-saves to your pin dataset (the same dataset you used to generate this map of all your delivery locations).
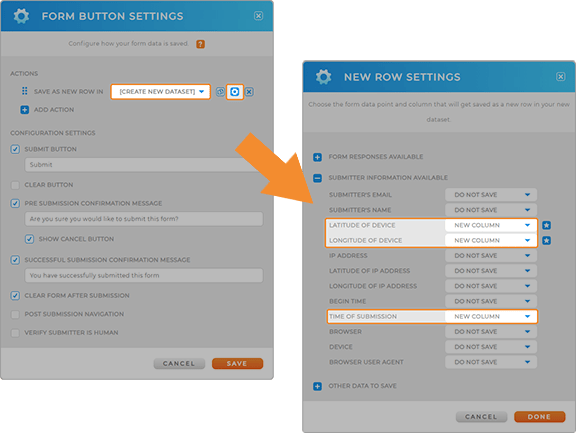

Pro Tip: For the most accurate delivery drop-off data, ensure your team optimizes their devices for the best GPS location accuracy.
WATCH YOUR MAP UPDATE IN REAL-TIME
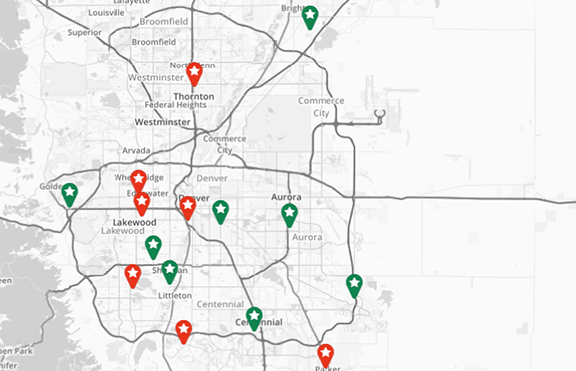
Now, you can sit back and watch as your map updates every time a delivery is completed! Never again wonder where a package was left, or whether a delivery was actually made.
Instead, just open your map and click the location in question– the pin bubble shows key details about each location, empowering you to quickly access delivery photos, time and location stamps, and other important information about each delivery location.
MONITOR, ANALYZE, OPTIMIZE
Wow, you just created a super-powerful map to manage all your deliveries! How incredible is that?
But this is more than a map–it’s a holistic system that empowers you to see everything in real time so you can manage operations like the pro you are.
And this is just the beginning! You’ve empowered yourself to monitor operations, but you can do so much more with this system. Here are some of the truly powerful capabilities you now have at your fingertips:
- Easily pinpoint missed or late deliveries in a glance
- Create charts and reports so you can identify recurring issues over time
- Automatically reassign missed deliveries to the next available driver and route
- Create powerful route automations that take everything into account so nothing ever falls through the cracks
