Quick Reference Guide
Datasets: Dependencies
ADD TO NEW VIEW
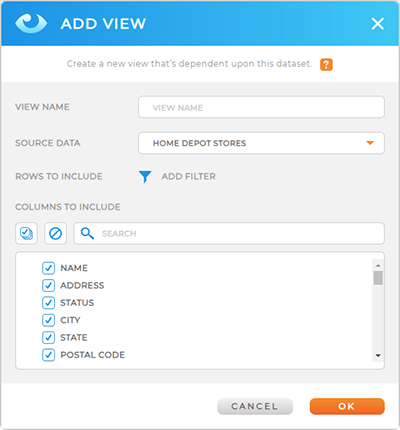
Create a new view from the data from this dataset.
Just name your view, confirm your source dataset, add any necessary filters, and select which columns you’d like to include on this view. Then, click the orange OK button at the bottom-right of the ADD VIEW window.
This process is just like adding a new view anywhere else in Mapline, and your new view can be accessed from the Views Library.
ADD TO NEW MAP
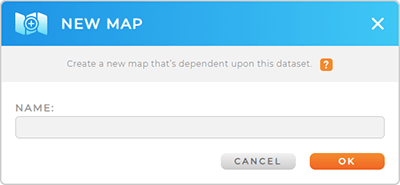
Create a new map that’s dependent upon this dataset.
Just name your map and click the orange OK button at the bottom-right of the New Map window.
The new map auto-saves to your Maps Library. When you open your map, the locations from this dataset will already be visible as pins on the map.
From there, you’ll customize your map according to your needs. Create territories, add shapes, style your pins, add Mapline Data, and more.
ADD TO EXISTING MAP
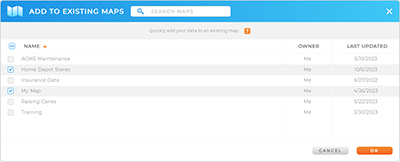
Add data to an existing map in seconds.
Select the map you need from the list. If you need to add your data to multiple maps, feel free to select them all at once.
If you have lots of maps saved to your Maps Library, use the Search at the top of the window to find the correct map even faster.
Once you’ve selected the desired map(s), click the orange OK button at the bottom of the window.
Your data is now tied to the map(s) you specified! To access it, visit your Maps Library or use the right in your dataset (described below).
Pro Tip: Do not de-select a map from this list unless you’re certain you want to permanently delete the dataset from that map. If you do happen to accidentally delete a dataset from the map, it can easily be restored. However, certain configurations, such as map styling and Mapline data, will need to be re-applied after restoring the dataset.
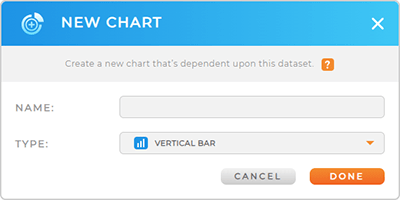
ADD TO NEW CHART
Create a new chart that’s dependent upon this dataset.
Name your chart, then select which kind of chart you need. Choose from the following:
- Vertical bar
- Horizontal bar
- Pie
- Donut
- Line
- Area
- 100 percent area
- Scatter
When you’re finished, click the orange DONE button at the bottom of the window. Your new chart is now accessible via the Charts Library.
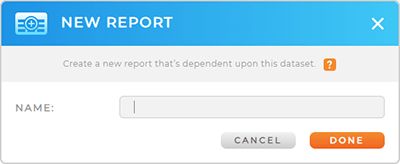
ADD TO NEW REPORT
Create a new report that’s dependent upon this dataset.
Name your report, and then click the orange DONE button at the bottom of the window.
Your new report is now accessible via the Reports Library.
VISUALIZATION SHORTCUT
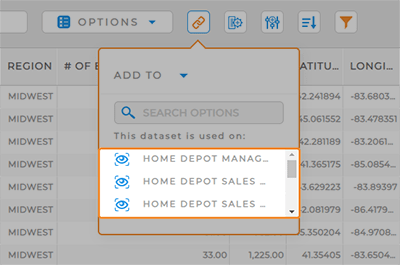
Once you have visualizations that depend on this dataset, they appear under the DEPENDENCIES icon. This way, you can always reference which visualizations are tied to your data.
The DEPENDENCIES icon is also a shortcut. Navigate from your dataset directly to any visualization tied to this dataset, without having to click into your Libraries.
Now that’s pretty sweet!