V5 Update Summary
If we were to sum up the year 2016 in one word, it would be “change.” Yes, a lot of changes happened this year, changes that best suit you, our dear Mapline users. We are committed to continuously add more features to the application that will help our users find fast results in mapping. So what have we been up to for the past few months?


Mapline’s V5 Update Takes Simple to a New Level
What better way to improve than to remain true to our name – Mapline. Hence, we find that simplicity is essential in creating a powerful data analysis tool. The simpler it is to use, the better the results of your decisions. With simplified navigation, we can make mapping and analysis become entrenched within your organization. Here are some of the changes in our V5 update that add up to the new “look” of Mapline:- What’s New Link – In just one click, you can see the features/changes that were recently added. This is a great addition since you will be informed of the changes before you actually start mapping.
- Menu in the Logo – As you click the Mapline logo, you will see the Datasets and Maps options – so you can quickly jump right into mapping!

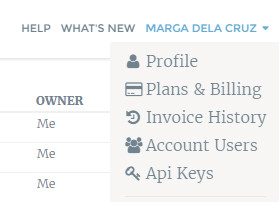
- Profile options in top right menu – Need to change something on your profile? Just click your name at the upper right corner and click “Profile.”

- Home and Account pages are mobile-friendly – With more and more users reviewing their accounts using their hand-held devices, we’ve optimized more of our site for mobile-friendly viewing and navigation.
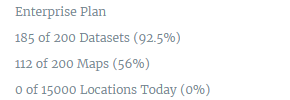
- Plan limits and geocoding limits display on bottom left – Here’s a summary of your plan limits so you would know what has been consumed and what are the remaining limits – strategically located to keep you informed.

- Messages appear when logging in – >After logging in, a message will appear at the bottom of the page – be it a reminder, a tip or a suggestion.
- Simplified navigation menu – Need I say more?
- Your Data Stays in Its Original Format – Previously, the order of your columns and your column headers could be changed when they were uploaded. Now, your data will be preserved exactly as you uploaded it, both in the spreadsheet view and in the bubble on the maps.
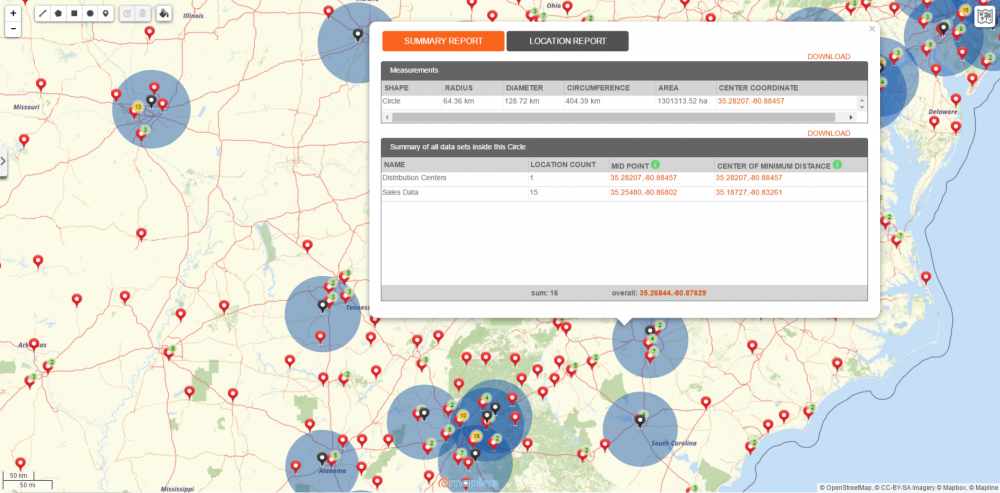
- Territory Reports to our Coverage Overlay Feature – Now, instead of having to draw custom circles around each pin to get a territory report, you can use the coverage overlay to do it for you. Then you can click on whichever location you want to get a report for, and Mapline will show you all the data within that coverage area.


