COOK ISLANDS COUNCILS
- Territory Guide
- COOK ISLANDS COUNCILS
Add Cook Islands councils to your maps to evaluate how council boundaries affect your business growth! Get insights into regional trends, customer distribution patterns, and factors impacting sales. Harness this territory map to generate new insights into your business operations and audience.
Dive into the power of council-level insights and elevate your geospatial analysis. Here’s how to add Cook Island councils to your map in a flash!
WHAT ARE COOK ISLANDS COUNCILS?
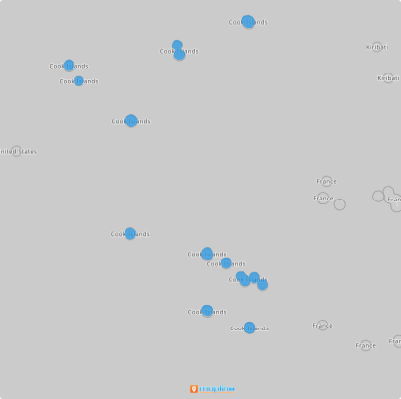
The Cook Islands are a sovereign nation in the South Pacific Ocean comprised of 15 islands. Each island has its own island councils, except for Nassau, which is goverened by Pukapuka. Each council oversees specific areas, providing essential infrastructure and community services. It is considered to be one of the top-rated tourist islands in the world, with around 100,000 visitors travelling to the islands each year.
You can leverage council-level maps to pinpoint regional patterns, tailor marketing campaigns, and optimize logistical operations. This is a powerful way to analyze local markets and fine-tune your strategies on a regional level.
ADD ISLANDS COUNCILS
Discover the strategic advantage adding a map of Cook Island councils to your business toolkit. Enhance your market insights and operational efficiency by overlaying detailed council-level data on your maps.
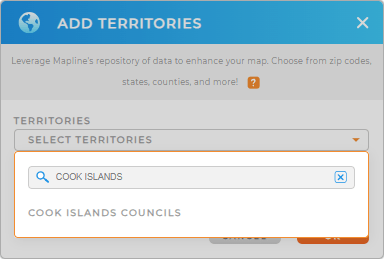
First, add a new territory from Mapline’s repository, then type COOK ISLANDS into the searchbar and select COOK ISLANDS COUNCILS.
Woah, that was fast! You’re almost ready to gain precise geographic context that empowers informed decision-making and strategic planning across your operations. There’s just one more quick step.


Pro Tip: Unlock the potential of Mapline’s global territory repository to enhance your spatial analysis capabilities. Customize map views with dynamic territory styling and explore diverse geographic insights tailored to your real-time business data.
CHOOSE COUNCIL COLORS
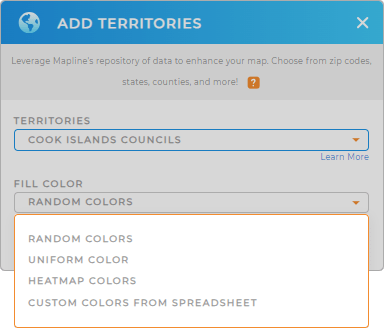
Enhance your data visualization and analytics with custom color styles! Colors create a clear, visual distinction between council boundaries, helping you hone in on performance metrics, demographic trends, or operational efficiencies at a glance.
Just select your desired type of color styling from the drop-down menu, then click OK.
Are you kidding me? In just a few clicks, you’ve empowered yourself to tap into actionable insights whenever you need them. That’s amazing!

GET NEW TERRITORY INSIGHTS
But it doesn’t end there! Boost your business analytics and strategic planning with these powerful capabilities:
- Seamlessly integrate interactive council maps into your dashboards or share them with your team to enhance data-driven decision-making
- Add your own demographic overlays to analyze population distribution across councils, optimizing service coverage and market penetration strategies
- Generate comprehensive reports on council demographics and consumer behavior to inform targeted marketing strategies


