- Blog
- Geo Mapping
- Create a Custom Map with Pins (No Coding Required)
If you’ve ever tried to get a clear picture of your customer locations or service areas using only spreadsheets, you know how limiting it can be. A visual map that shows exactly where each point exists in the real world makes decision-making faster and more accurate. That’s why so many teams are turning to simple tools that let them create a map with pins—no coding, IT support, or GIS knowledge required.
Pin maps help you uncover patterns, track coverage, and find opportunities at a glance. Whether you’re in sales, operations, or logistics, mapping your data unlocks insights that static charts just can’t deliver.
How to Make a Map with Multiple Pins—No Tech Skills Needed
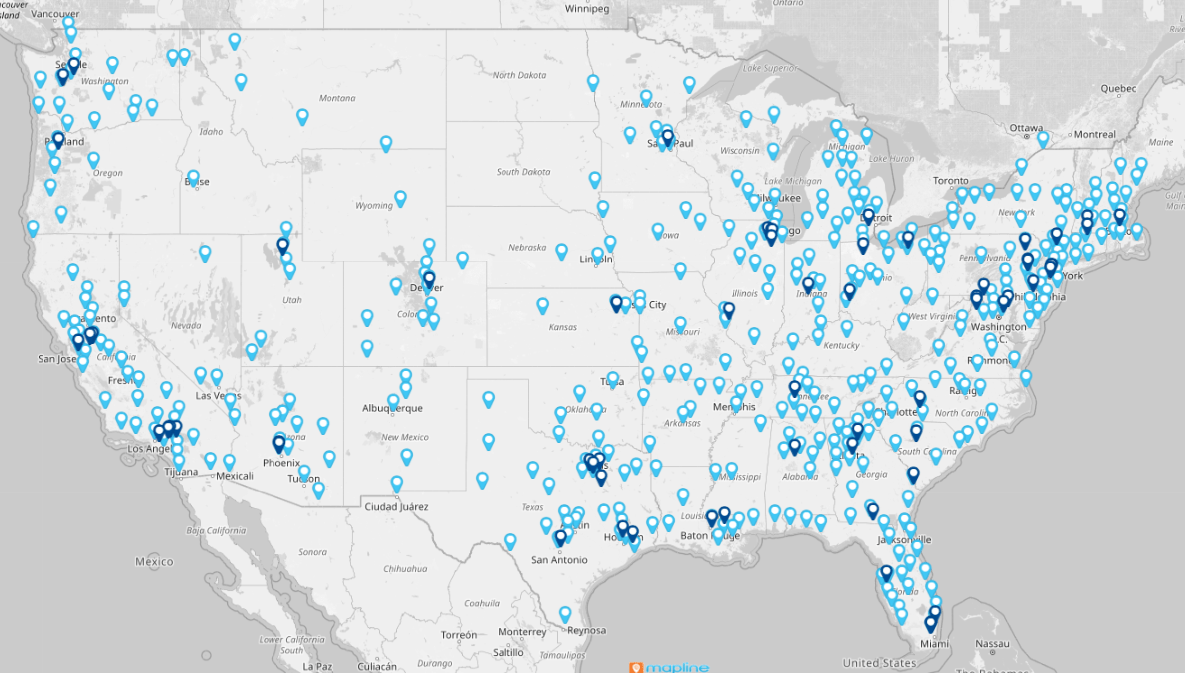
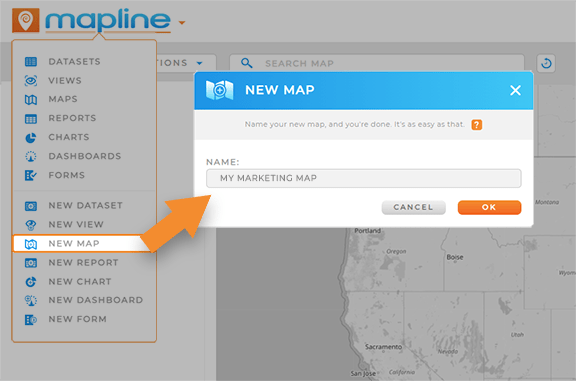
You don’t need to be technical to get started. In fact, tools like Mapline are designed so anyone can upload a file and instantly see their data brought to life on a map. The process is refreshingly simple: just upload your spreadsheet, choose the column that holds your location data, and the system will automatically generate pins for each one.
From there, you can personalize the look of your map—change the colors, assign pin shapes by category, or adjust the labels. Need to show just your top clients or filter by region? Dynamic filters let you control what’s visible, so you can tailor the map to your exact needs.

Pro Tip: Don’t waste time wrestling with complicated GIS tools or outdated apps. A platform like Mapline lets you upload your data, instantly generate pins, and customize everything, all without writing a single line of code.
You can filter by category, color-code pins, and even add layers like territories or routes. Start with a free map and see how intuitive the process can be; your next project might take minutes, not hours.
Why a Customizable Map with Pins Beats Static Maps
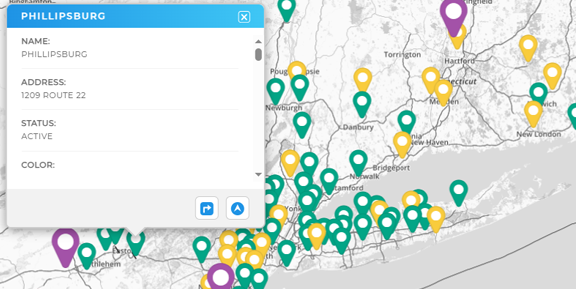
What sets a customizable pin map apart from a screenshot or manual graphic is how flexible and interactive it is. Once you’ve built your map, you can click on each pin to view details like contact info or sales numbers, group pins by rep or region, and even overlay it with your sales territories or zip code boundaries.
This means you’re not just creating something pretty, you’re building a business tool you can actually use to plan your day, lead your team, or impress stakeholders. Some users even embed their maps on internal dashboards or client-facing portals to keep everyone on the same page.

Who Uses Maps Like This?
It’s easy to think this type of tool is just for logistics or delivery teams, but the use cases go far beyond that. Sales teams use it to monitor pipeline density and regional coverage. Field service companies plan efficient routes and avoid overlapping technicians. Marketing departments rely on visual customer clustering to plan events or target outreach campaigns. And executives often use interactive maps in presentations to quickly convey performance trends by geography.
If you’ve got locations, addresses, or geographies in your data, there’s probably a reason to visualize it on a pin map.
What is the easiest way to create a custom map with pins?
Creating a map with pins is easier than most people think—especially with intuitive tools like Mapline. All you need is a spreadsheet containing location data, such as addresses or zip codes. Upload the file, and the system instantly plots each point as a pin on your map. From there, you can color-code by category, customize pin shapes, and even adjust labels for clarity. There’s no need for coding, GIS experience, or complex software. Whether you’re managing field reps or tracking client locations, it’s one of the fastest ways to visualize your data in a meaningful way.
How can businesses use a pin map to analyze market saturation?
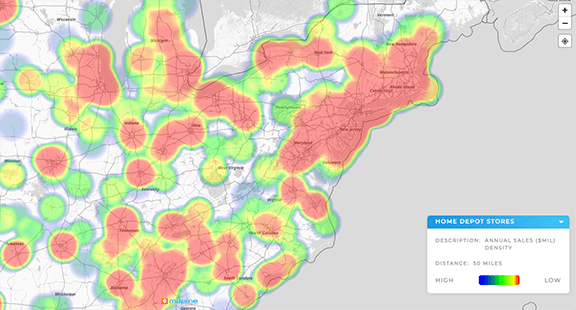
Pin mapping gives you immediate visual context that static spreadsheets can’t provide. By layering pins over defined regions, businesses can quickly see which areas are oversaturated and which ones show growth potential. For example, many busineses use pin maps to:
- Plot customer or lead locations to spot geographic clusters or gaps.
- Overlay territories to evaluate rep coverage and workload balance.
- Use radius mapping to highlight service areas or competitive reach.
This is especially helpful for sales planning, territory design, and market expansion. You can also identify underserved zones and plan outreach more strategically. With the right tools, analyzing market saturation becomes a visual process that anyone can understand at a glance.
The Best Tools to Create a Map with Pins
There are quite a few options available online, but not all mapping tools are built the same. Mapline stands out for business users because it supports advanced features like routing, territory overlays, and filterable dashboards, all while keeping the interface clean and simple. You can upload a spreadsheet, customize your pins, and share your map with a link, embed code, or export it as a static file.
Google My Maps is a decent starting point for personal projects or lightweight mapping, but it lacks the depth and filter logic that most teams need. BatchGeo is another easy entry tool, but you’ll hit limitations fast if you’re working with anything beyond basic pin plotting. Meanwhile, some options like ZeeMaps and uMap offer more customization but have clunky interfaces or hidden costs.
If your goal is to create a map with multiple locations free and also scale your capabilities as you grow, there’s no better choice than Mapline.
Mapline vs Other Pin Mapping Platforms
When you compare tools side-by-side, the differences are clear. Mapline doesn’t just let you drop pins, it empowers you to take action. You can visualize your data, drill into performance, optimize delivery routes, and collaborate across teams. Google My Maps and similar tools can help in a pinch, but they lack built-in business logic.
| Feature | Mapline | Badger Maps | Maptive | Caliper (Maptitude) | eSpatial |
|---|---|---|---|---|---|
| Bulk Upload from Excel/CSV | ✓ | ✓ | ✓ | ✓ | ✓ |
| Advanced Pin Customization | ✓ | ✓ | ✓ | ✓ | ✓ |
| Territory Mapping & Custom Boundaries | ✓ | ✓ (sales-focused) | ✓ | ✓ | ✓ |
| Territory Reporting & Aggregations | ✓ | X | X | ✓ (manual setup) | ✓ (limited) |
| Route Optimization | ✓ | ✓ | ✓ | ✓ | ✓ |
| Real-Time Re-Optimization | ✓ | X | X | X | ✓ |
| Coverage Circles / Radius Mapping | ✓ | ✓ | ✓ | ✓ | ✓ |
| Filtering & Data Segmentation | ✓ | ✓ | ✓ | ✓ | ✓ |
| Built-In Business Logic (Mapline Data) | ✓ | X | X | ✓ (complex setup) | X |
| Automated Workflows | ✓ | X | X | X | X |
| Integrations & API Access | ✓ | ✓ (CRM focused) | ✓ | ✓ (limited) | ✓ |
| Ease of Use | ✓ | ✓ | ✓ | X | ✓ |
If you’re managing territories, dispatching service reps, or sharing updates with clients, Mapline’s ability to integrate with other data, adjust visuals on the fly, and scale up routing makes it a strategic tool, not just a map.
Advanced Features That Take It to the Next Level
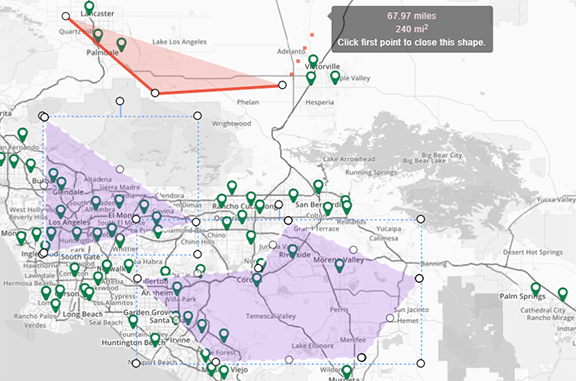
Once your map is built, the real power comes from layering in features that serve your workflow. You can draw radius circles around pins to evaluate delivery zones or service gaps. You can overlay your pins with predefined territories and then filter the view to focus on a single manager or rep.
You can even integrate live data so that as your CRM updates, your map reflects changes in real time. Need a visual for a presentation? Generate a polished export. Want to monitor team activity in the field? Use Mapline’s dashboards to pull in route data and time stamps. These capabilities take your map from a one-time visual to a daily-use asset.

Pro Tip: If you want to impress your stakeholders, embed your interactive pin map into a dashboard or slide deck—it makes data storytelling instant and impactful.
Real-World Impact: Why Teams Rely on Pin Mapping Tools
Mapping software isn’t just a nice-to-have, it solves real operational problems. When you create a map with multiple locations, you’re not just looking at dots. You’re unlocking location intelligence that helps you answer questions faster, uncover problems earlier, and reduce friction in everyday workflows.
Consider a regional sales manager who wants to see all active accounts across five states. A static spreadsheet won’t show the spread. A map instantly highlights regions with high density—and just as importantly, areas where there are gaps. That means smarter territory assignments and fewer missed opportunities.
Or take a field operations coordinator trying to balance technician workloads. With pins color-coded by technician and territory overlays enabled, they can visually audit whether one rep is overloaded while another covers too little ground. This saves time and boosts morale.
The real value of creating a map with pins isn’t the pins themselves—it’s the insight and alignment those visuals enable.
Eliminate Errors, Accelerate Growth
“When we started using Mapline, we were immediately able to identify human errors just by seeing them on the map,” says Adam Aldridge, Operations Manager at Pelican’s Snoballs. What once required hours in Excel now takes minutes—Mapline makes it easy to visualize franchise data, eliminate territory overlap, and plan expansion with confidence. With Geo Mapping at their fingertips, Pelican’s has become more efficient, more accurate, and more data-driven than ever before.


Streamline Sales, Prove Value
Mapline’s Geo Mapping helped The Grit Game transform their sales process from reactive to strategic. Reps can now submit visit data, kick off automated tasks, and access real-time dashboards that highlight their impact. With robust data protections in place, client information stays safe while the team moves fast. By visualizing performance and uncovering new market opportunities, The Grit Game has eliminated manual busywork and can now scale with confidence.
Impress Clients, Drive Sales
“I’m able to get a very complex, very deep and profound analysis. Then, when I meet with clients, it’s just a wow factor,” says RE/MAX broker Juan Irala y Hernández. “It makes the impression very distinct with the client and helps me make the sale.” With Geo Mapping, Hernández can visualize properties, highlight high-demand areas, and deliver insights that drive confident, data-backed decisions—resulting in 50% year-over-year sales growth. Now, he’s not just staying competitive—he’s redefining what success looks like in real estate.
Combining Pin Maps with Territory & Routing Logic
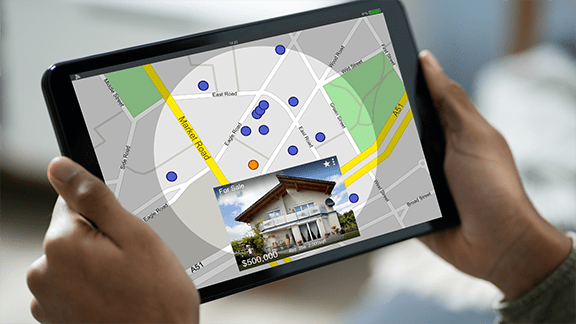
One of the most powerful ways to level up your map is to connect your pins with territory mapping and routing logic. Instead of managing these components separately, Mapline allows you to combine them in one workspace.
Let’s say you’ve already created a map with pins: customers, locations, or deliveries. Now you want to assign those pins to reps based on regional boundaries. With Mapline, you can draw or import territories (like zip codes, counties, or custom shapes) and automatically group pins inside them.
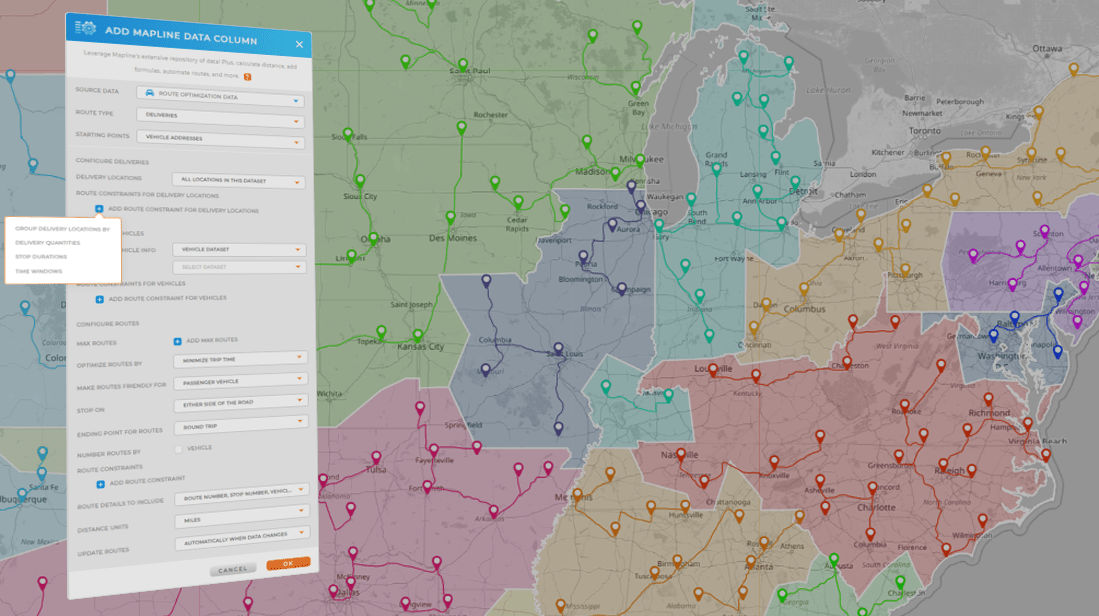
From there, it’s easy to apply route optimization; either to all pins in a territory or by filtered tags (like product type or priority). You can even set routing constraints like vehicle capacity, time windows, or roundtrip logic. These workflows turn your map into a true dispatch tool, with real-time decision-making power.
Territory Mapping for Workload Balance
Territory logic ensures that your pins aren’t just visually grouped—they’re strategically assigned. With Mapline, you can draw boundaries based on your own criteria or import official postal zones to define sales regions, service zones, or rep responsibilities.
This helps eliminate overlap, clarify expectations, and balance workload. If one territory has too many service stops while another is light, you’ll see it at a glance and can rebalance accordingly. Over time, this improves coverage, performance, and customer satisfaction.
Route Optimization from Pinned Locations
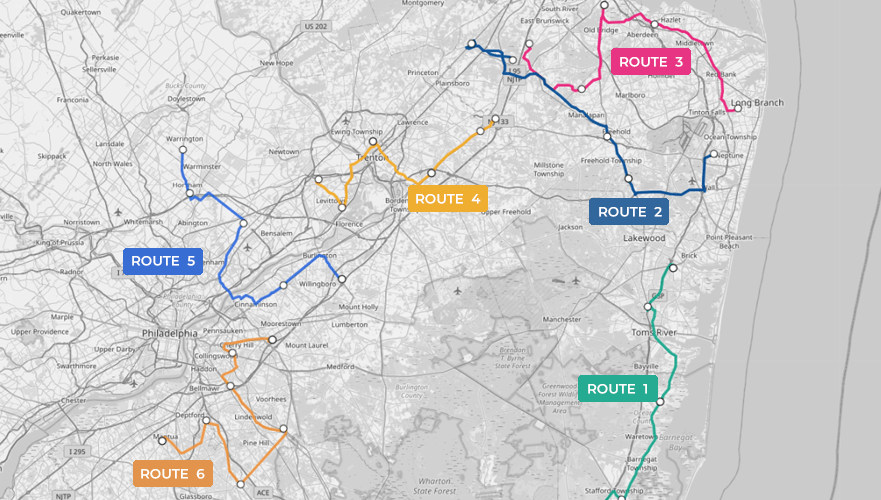
Once your pins are organized by territory, applying route optimization helps reduce travel time, cut fuel costs, and ensure every field agent is operating efficiently. Whether you’re optimizing a single driver’s schedule or coordinating dozens of vehicles, Mapline’s built-in routing logic adapts to your needs. You can choose shortest distance, fastest route, or custom stop orders based on your business priorities.
This makes it easy to schedule visits, deliveries, or inspections in a logical sequence, and adjust routes instantly if something changes. Teams save hours each week by eliminating manual route planning and reacting faster to last-minute updates.
Common Workflows That Combine Pins + Territories + Routing
Here are just a few examples of what users can do when they integrate pin mapping with route logic:
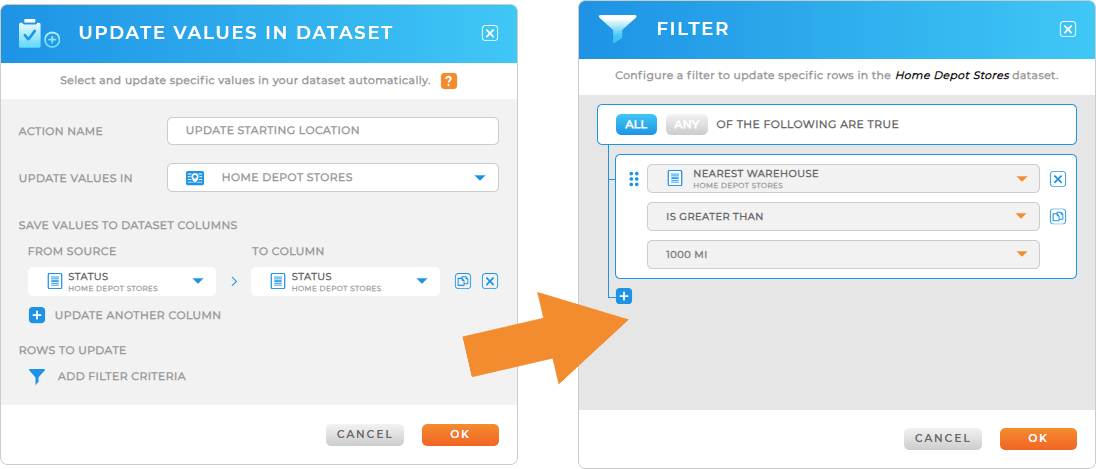
- Assign new leads to the closest rep based on territory and travel radius
- Re-optimize all routes after a new job is added or a cancellation occurs
- Visualize which pins fall outside of defined coverage zones
- Balance workload by reassigning pins across territory boundaries
These workflows aren’t theoretical—they’re used daily by teams in industries like delivery, home services, solar, property inspections, and B2B field sales.
Design Tips for Creating a Map That Works
While Mapline makes the technical part simple, you still want to design your map for clarity and impact. Here are a few best practices to keep in mind:
First, use color intentionally. If every pin is red, your map loses visual meaning. Instead, assign different colors based on rep, status, or region. Green for active accounts, orange for prospects, red for churn risks—that tells a story at a glance.
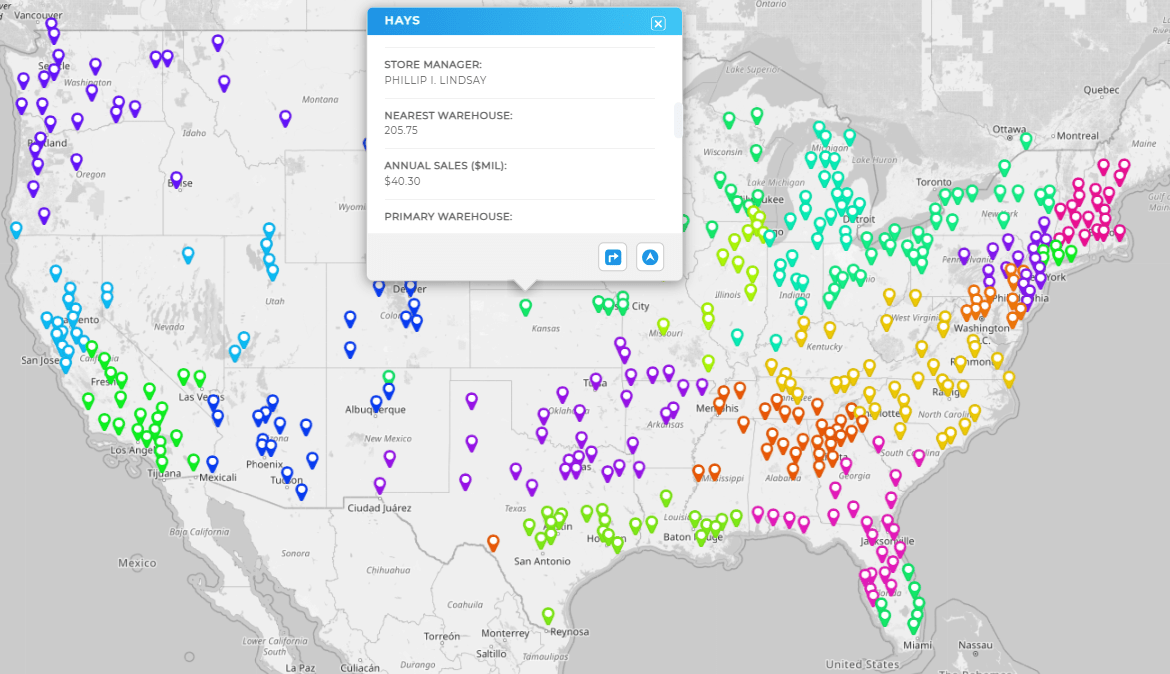
Second, think about scale. If you’re showing thousands of pins, consider using pin clustering or filters to reduce visual clutter. Start zoomed out with clusters, then let users zoom in to see individual locations as needed.
Third, don’t forget labels. In most cases, you’ll want to label pins with a field like name, rep, or region. Mapline makes it easy to control what shows up when you hover or click.
Finally, if you’re sharing maps externally (like embedding in a client portal or sharing with executives), use Mapline’s style controls to apply your brand colors, add a logo, and control what elements users can interact with. This makes the map feel like a polished extension of your business, not just a visualization tool.
Unlocking the Power of Location Intelligence
Creating a map with pins may start with visualizing your data, but the real magic happens when you start using those maps to guide decisions. With features like dynamic filters, dashboards, routing tools, and territory grouping, a pin map becomes a daily resource for every department.
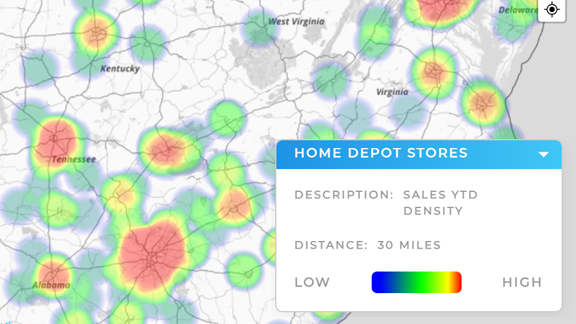
Sales leaders use it to allocate resources. Operations managers use it to deploy teams. Executives use it to review market penetration. And marketing teams use it to plan campaigns based on customer clusters or heat maps. That’s the power of embedding location intelligence into your workflows—it makes your data instantly more actionable.
If you’ve ever thought of map tools as “just for field teams,” it’s time to reimagine what pin mapping can do for your entire business.
You’re Closer Than You Think
You don’t need to hire a developer, install GIS software, or take a course to get started. You can start for free with just a spreadsheet. Upload your data, watch your pins appear, and explore your options. Within minutes, you’ll be identifying trends and patterns you couldn’t see before.
Mapline’s pin mapping solution is built for real business users, not just map nerds. If you can use Excel, you can build a stunning interactive map that adds value to your day-to-day decisions.
You can use Mapline’s free plan to upload your spreadsheet, generate pins instantly, and customize your map without needing any technical knowledge.
Absolutely. You can generate a public or private share link, embed your map into a website, or export a static image for emails or presentations.
Mapline allows plotting by zip code, city, or even latitude and longitude. You can build a map using any consistent geographic reference in your data.
Yes. A pin map simply shows where your points are. A routing tool builds optimized paths between them. Mapline lets you do both in one place—so you can go from visualizing to planning in just a few clicks.
Mapline offers a free tier that supports pin mapping and basic customization. If you need advanced features like demographic data, distance calculations, or bulk routing, you can upgrade as needed.


