Sales Territory Mapping Analysis
Spend less time managing territories. Spend more time making strategic business decisions.
Plot pins based on customer or prospect zip codes, draw shapes around territories specific to your business, and generate territory-specific customer reports for optimized communication and efficiency. Customer segmentation and territory overlay features give you the power to improve how you manage sales reps and teams. Discover the possibilities with sales territory mapping software from Mapline.
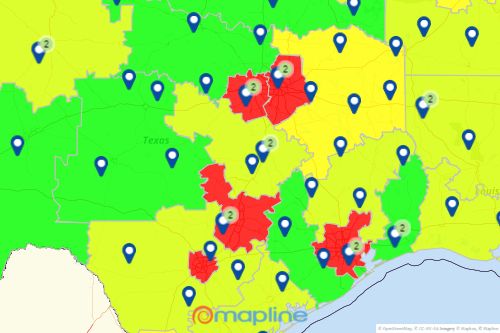
Predefined territories and custom territories
Whether you use government or custom boundaries for your territories, Mapline has you covered. And setup is simple—once you have your territories on the map, customize by color so that each territory is unique. Next? You can analyze each territory’s performance, and identify what is causing revenues to change.


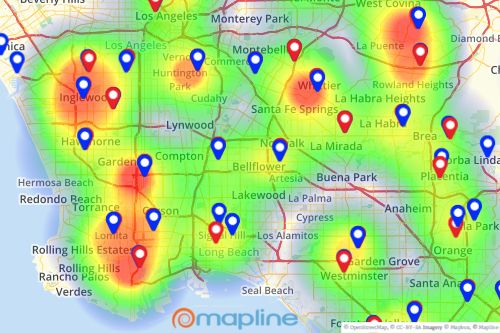
Powerful heat maps
In Excel, you can easily see which territory is performing the best in certain categories. However, sometimes a territory performs well—but only in certain areas. It helps to know where your revenue, costs and customers are coming from within a certain territory. Mapline makes this possible with territorial or radial heat mapping. Make better use of your time—utilize heat mapping to concentrate your efforts on high-priority areas.
Simple data tracking
When dealing with a large amount of data within your territories, it can be difficult to figure out if locations with similar characteristics are close geographically. That’s what segments were made for! Quickly and easily upload your customer list into Mapline to see where the data is located. You can break them up based on criteria, such as amount purchased, type of product or service purchased, frequency of purchases and so much more. It’s simple—just import the data to easily differentiate the pins, quickly analyze, and make strategic decisions.


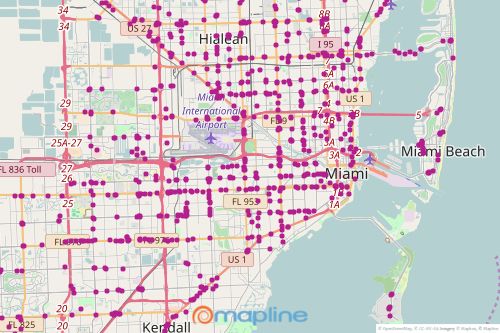
Spatial analysis made easy
Sometimes, it’s difficult to identify certain data patterns within the confined rows and columns of a spreadsheet. When you create a dot density map, color-coded dots populate across a landscape, bringing to life patterns within your geographic data that you may not have noticed otherwise. Uncover insights with Mapline’s dot distribution tool to determine new shipping routes—or even expand into an untapped market.
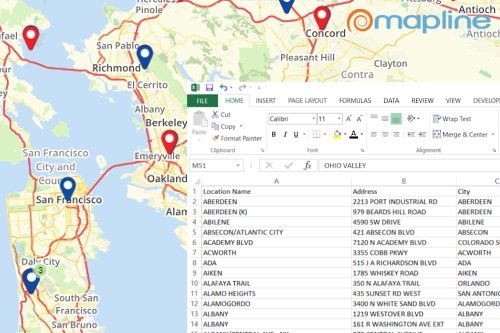
Mapping your Excel data
Creating a map from Excel data takes only seconds. Copy and paste or upload your spreadsheet and watch as your data is visualized in real time. It’s really that simple! Plus, when you map Excel data with Mapline, you have the power to analyze trends, make smarter business decisions and claim big opportunities as soon as they arise.

Dive into Data Mapping
Whether you’re in retail, manufacturing, energy, insurance or a host of other industries, you can gain a competitive edge with data mapping. Explore industries Mapline serves to learn how business mapping software has the solutions you need to optimize your business for success.


