Segment Your Customers or Store Locations
Create customer segments when you map Excel data with Mapline.
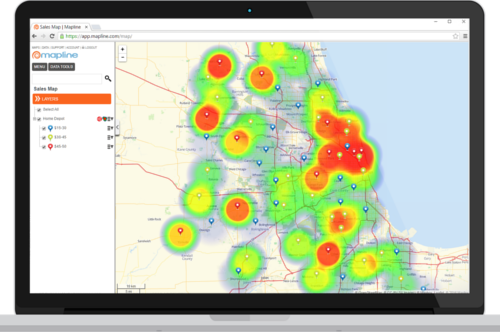
If rows and columns of data make your head spin, it’s time to map your Excel data for better visibility. Mapline helps you create customer segments by hiding the pins you don’t want to see and showing you the ones you need. Group and regroup data, color-code pins and present seriously impressive reports. When you map customers with Mapline, you look good.
Avoid the crowd with segments
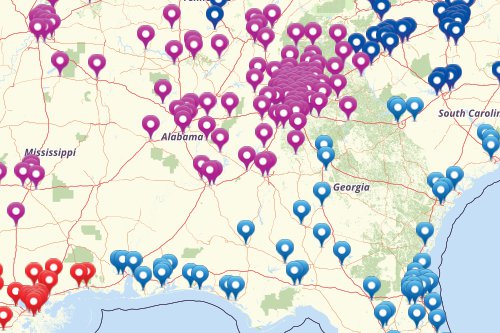
Hundreds or thousands of pins on a map is difficult to analyze. Segments let you view the pin locations you want to view and hide the ones you don’t need to see. Mapline makes life easier when you need to segment and map customers, retail stores or distribution centers!


Segment your pins how you want
Want to view your pins based on your customer segments? Segments can do that. Create customer segments, or segment by location type, region, and more to easily find the trends and insights you’re looking for when you set out to map Excel data.
Easily create intricate, three-layer maps easily
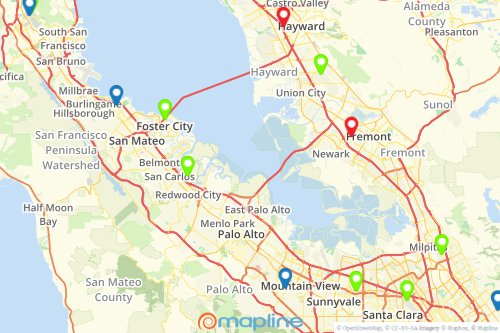
Get creative with segments by regrouping your data to create a three-layer map, showing addresses, distribution centers and competitors. Then, use different colors to identify trends and relationships between the different groups you’re analyzing.

Impress your colleagues in presentations
With segments and the ability to create color-coded, three-layer maps, you can highlight key points and trends easily in presentations that will wow your boss and teammates.
Ready to add segments to your maps? See how you can leverage sublayers when you map your own Excel data.
Make analysis easier by grouping your data!
Explore Our Other Mapping Features
Want to know what else you can do beyond segmenting your data? Check out our other features:


