
Mapping Sectors of Guinea-Bissau Fills In the Thirst for Location Information
Map of Guinea-Bissau Sectors – More Than Just Attractive Visualization
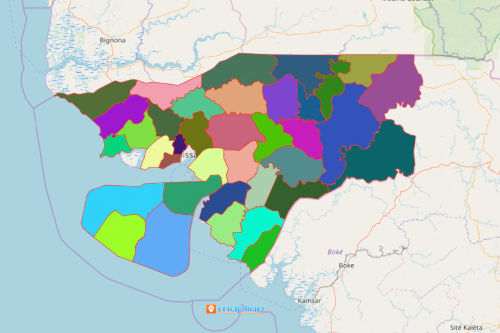
Mapping sectors of Guinea-Bissau is a fundamental step used by different industries for decision-making. Guinea-Bissau is divided into 37 sectors. These are further divided into towns, villages, localities, settlements, communities, and others. When Excel spreadsheet data is mapped along with the sector boundaries, it amplifies the capabilities of location analysis. Furthermore, the users can immediately understand the significance of data points on their boundaries. Thus, it is a big help for data analysis as the time spent analyzing and decoding patterns is trimmed in half.
Mapline makes maps more functional and flexible to users. Its powerful tools are built to get the full sense of data. Tools like heat mapping or distance calculation helps significantly to achieve these goals.
Not Just a Map But a Powerful Data Visualization
Turn Excel spreadsheet data into a board of strategic insights! When boundaries and data are bound together to form a map, you will start to realize that the map is not just attractive. It actually points out what each sector is going through. So start by creating a map of sector boundaries:
- Create a Mapline account and login.
- Click the orange “Add New Items” button.
- Select “New Map” on the drop down arrow.
- Give your map a name and click “OK.”
- Click the “Add” button from the left sidebar.
- Select the “Territories” option.
- Click “From Mapline’s Repository.”
- From the “Territories” select “Guinea-Bissau Sectors.” Use the search bar for quicker results.
- Select how you want your boundaries to be colored in “Fill Color” (Random Colors, Uniform Color, Dynamic heat map colors, or Custom colors from spreadsheet).
- Click “OK.”
Mapping boundaries such as sectors truly fills the thirst to get accurate information about each sector. Sign up now and learn more about the right tools to use for data solutions.