
Understand Location Data with a Madagascar Region Map
A Region-Level Map Leads to Pattern Discoveries
A Madagascar region map is a highly important tool for government agencies to understand location data. The Malagasy government recently announced that the country is under the second wave of Covid-19. Mapping the regions helps the agencies to understand the scope of the virus by region. Hence, Mapline makes it easy and simple to plot location data on a map and overlay region boundaries. A careful study of data allows government agencies to act quickly. A region map helps them to determine the precise locations of affected areas. Information extracted from analyzting the map is used for quicker responsiveness against the spread of Covid-19 virus.
As an effective data visualization tool, a region-level map gives the organizations an aerial view of where the virus started to occur, along with the affected areas. In addition, Mapline enables the users to customize their map pin icons. This powerful mapping ability helps in quickly distinguishing different layers for data analysis. Furthermore, it leads to more pattern discoveries that are vital for decision making.
Enhance Data Analysis with a Madagascar Region Map
A map of regions does not only focus on giving out locations. More than that, it provides connections between locations and their territory boundaries. Fortunately, map creation using Mapline is the easiest on the planet! Just follow these steps and your map is built in seconds:
- Create a Mapline account and login.
- Click the orange “Add New Items” button.
- Select “New Map” on the drop down arrow.
- Give your map a name and click “OK.”
- Click the “Add” button from the left sidebar.
- Select the “Territories” option.
- Click “From Mapline’s Repository.”
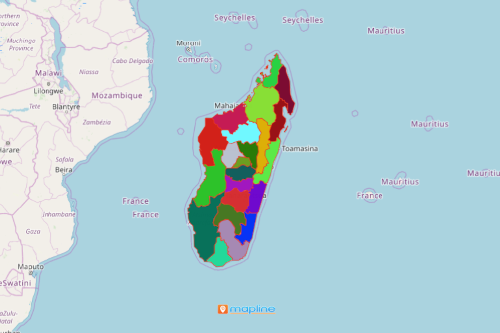
- From the “Territories” select “Madagascar Regions.” Use the search bar for quicker results.
- Select how you want your boundaries to be colored in “Fill Color” (Random Colors, Uniform Color, Dynamic heat map colors, or Custom colors from spreadsheet).
- Click “OK.”
Indeed, data understanding leads to faster and safer responses. Sign up now and take advantage of using other powerful mapping tools to understand location data better.