
Niger Department Map Reveals Deeper Insight on Risk Management
A Department-Level Map for a More Focused Risk Reduction Planning
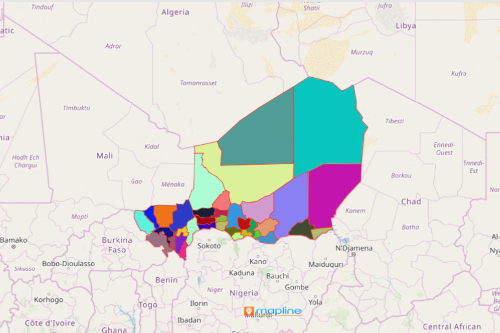
A Niger department map helps pinpoint areas of potential risks. It is used by local government agencies and private sectors. Niger is a landlocked country in the heart of Africa. The country is divided into 36 departments. A closer look into each department makes data analysis more focused. A map with an overlay of department boundaries serves as a guide to plan ahead amidst uncertainties brought by different types of risks. Hence, it is an early warning guide to help the community prepare better amidst potential risks.
Heat maps are used particularly for disaster management and risk reduction. It helps visualize which areas will be affected before a disaster strikes. Create maps by percentile of location density. It results in a powerful data visualization that helps to identify which areas may face potential risk. Because of heat map, government agencies can plan ahead and protect the communities even better.
Niger Department Map Helps in The Face of Risks
Here are the following easy steps that will help you get started in mapping:
- Create a Mapline account and login.
- Click the orange “Add New Items” button.
- Select “New Map” on the drop down arrow.
- Give your map a name and click “OK.”
- Click the “Add” button from the left sidebar.
- Select the “Territories” option.
- Click “From Mapline’s Repository.”
- From the “Territories” select “Niger Departments.” Use the search bar for quicker results.
- Select how you want your boundaries to be colored in “Fill Color” (Random Colors, Uniform Color, Dynamic heat map colors, or Custom colors from spreadsheet).
- Click “OK.”
Mapline provides more powerful mapping tools to help you with your back-up plans before facing different types of risks. Sign up now to know more about how maps could help give you a better view of your network in the face of risks.