
Smart Tools to Use When Analyzing Swaziland Map Showing Tinkhundla
Incorporate Mapping Analytics in Agriculture Management
To capture new location and spatial insights for increased agricultural productivity, regional administrators use some smart analytical tools when analyzing a Swaziland map showing tinkhundla. Swaziland (or Eswatini) is a country located in Southern Africa. The 55 tinkhundla are formed together to make up the 4 major regions of the country. Agriculture is one of the main economic factors of the country. Mapping Excel spreadsheets is crucial from the planning stage to managing different agricultural projects. During the planning stage, users can customize the location pins so they can quickly identify pertinent information related to the irrigation program. On the other hand, filtering the locations helps pinpoint spatial relationships of data. It helps identify areas that need special attention, areas with poor crop yield, or irrigable lands.
When challenges are visualized on a Swaziland map of Tinkhundla, plans are created in a way that tailor-fit to what is truly needed. If there exists a problem about water supply, project advisors and decision-makers can easily come up with the best plan to develop guidelines about water supply. One of the best tools to use for this kind of planning is Mapline’s Automate wherein team members can update and share reports real-time to keep track of their activities. With information-based planning, agriculture management will be successful.
Make Swaziland Map with Tinkhundla Work For You!
After following these 10 simple steps, you’re on your way to start mapping with a difference using smart mapping tools:
- Create a Mapline account and login.
- Click the orange “Add New Items” button.
- Select “New Map” on the drop down arrow.
- Give your map a name and click “OK.”
- Click the “Add” button from the left sidebar.
- Select the “Territories” option.
- Click “From Mapline’s Repository.”
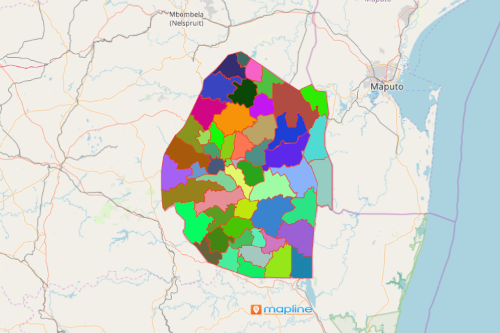
- From the “Territories” select “Swaziland Tinkhundla.” Use the search bar for quicker results.
- Select how you want your boundaries to be colored in “Fill Color” (Random Colors, Uniform Color, Dynamic heat map colors, or Custom colors from spreadsheet).
- Click “OK.”
Whether you are planning, or managing agriculture, there are a lot of smart mapping analytical tools that you can use when analyzing a Swaziland map showing tinkhundla. Sign up now and enjoy the benefits of using Mapline.