
The Smarter Ways of Mapping Georgia Regions
Use Mapping Analytical Tools for Decision-Making
When mapping Georgia regions with multiple data sets, do you really see important factors affecting your business? Can you perform in-depth analysis for data-based decision making? How does your map help you increase productivity and efficiency? A map that shows all the region boundaries is useful in identifying actual territories. However, to maximize a Georgia map with regions, powerful mapping tools should be used.
For example, if you would like to visualize your network, the network coverage overlay tool is the best tool for the job. In an instant, you can see which areas fall outside the coverage. Heat mapping is another smart analytical tool that lets you see areas where your business is more prone to risks. One other software to use is the Mapline’s Route Planning Software. It lets you analyze distances between all your locations so you can see ahead of time which challenges or disruptions may face your business. These tools are useful to help you plan ahead and act quickly to eliminate bigger problems.
Use The Regions Map of Georgia to Your Advantage
There are a lot more mapping tools that you can play around to help you get more patterns and insights from your data. But first, you need to follow these 10 simple steps to create a territory map. Then, start your analysis right away.
- Create a Mapline account and login.
- Click the orange “Add New Items” button.
- Select “New Map” on the drop down arrow.
- Give your map a name and click “OK.”
- Click the “Add” button from the left sidebar.
- Select the “Territories” option.
- Click “From Mapline’s Repository.”
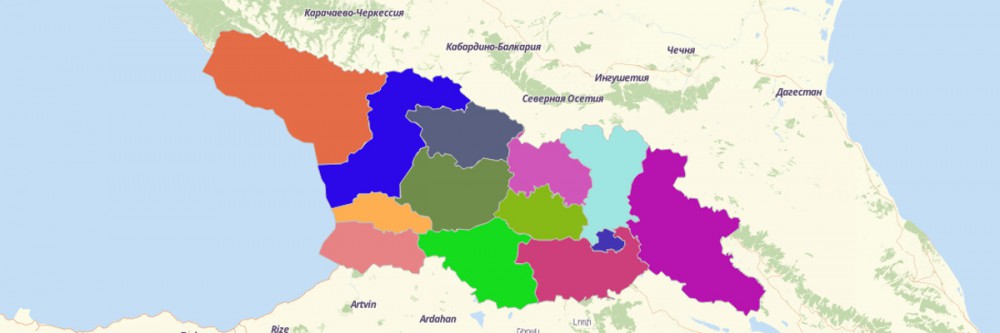
- From the “Territories” select “Georgia Regions.” Use the search bar for quicker results.
- Select how you want your boundaries to be colored in “Fill Color” (Random Colors, Uniform Color, or Custom colors from spreadsheet).
- Click “OK.”
Mapping Georgia regions can take you to a whole new level of data analysis and visualization. Sign up now and learn more mapping tools that you can use to help get the best data-based information pertinent to decision-making.