
How a Turkey Region Map is Used in Manufacturing Industry
A Region-Level Map as a Location Intelligence Tool
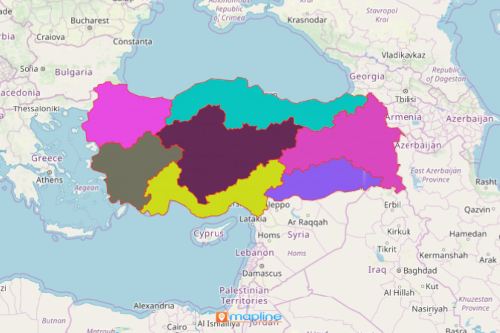
Companies in the manufacturing industry rely on a Turkey region map as a location intelligence tool. Turkey is a country nestled between 2 continents – Europe and Asia. It is divided into 7 regions. Manufacturing holds a key role in the country’s economy. Because of that, a region-level data analysis is highly useful when looking for areas for business development, extensions, or marketing.
One tool that helps the manufacturing company grow and monitor their business is heat map. It helps you visualize areas that are performing. To sustain the business, you can give more attention to areas that are under performing. Through heatmapping, important questions are quickly answered such as: Is there a potential risk? Is the competition too tough? What are the rooms for improvement? A radial heat map helps ignite ideas to visualize areas that meet your goals. It also shows areas that need improvement.
Heat Map Your Turkey Region Map
Overlay a region boundary in seconds. Once generated, apply the heat mapping tool to analyze your data:
- Create a Mapline account and login.
- Click the orange “Add New Items” button.
- Select “New Map” on the drop down arrow.
- Give your map a name and click “OK.”
- Click the “Add” button from the left sidebar.
- Select the “Territories” option.
- Click “From Mapline’s Repository.”
- From the “Territories” select “Turkey Regions.” You can also enter that on the search bar.
- Select how you want your boundaries to be colored in “Fill Color” (Random Colors, Uniform Color, Dynamic heat map colors, or Custom colors from spreadsheet).
- Click “OK.”
Create better strategic decisions as you use powerful mapping tools for your data analysis. Sign up now and see for yourself how your region map can be a smart location intelligence tool.