Canada Census Tracts
- Territory Guide
- Canada Census Tracts
A map of Canada Census tracts is a perfect fit for you if you want to achieve population-centric analyses rather than physical geography. A census tract has a population of not more than 8,000 people. That said, analysis on buying behaviors and characteristics can be easier achieved.
Mapline is your partner to create a map of Canada census tracts. In fact, you can start creating now!
WHAT ARE CANADA CENSUS TRACTS?
Canada census tracts are small, relatively stable geographic areas for conducting census data collection and analysis. These tracts typically contain between 2,500 to 8,000 residents and are designed to provide detailed demographic and socio-economic information at a local level.
For a business owner using Mapline, adding Canada census tracts to a map can offer valuable insights into localized market trends, customer demographics, and purchasing behaviors.
For instance, a retail company could use census tract data to identify high-density population areas for targeted marketing campaigns or to optimize store locations based on population distribution and consumer preferences. By visualizing census tract boundaries on a map, businesses can make informed decisions driven by live data. Let’s dive in!
ADD CENSUS TRACTS
Add Canada’s census tract boundaries to your map today and gain the edge you need! Pinpoint new market opportunities, streamline logistics, and strengthen customer connections.
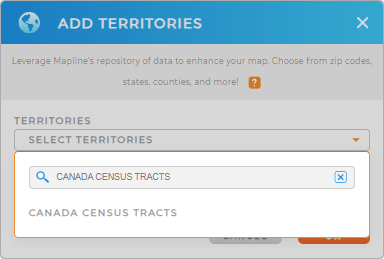
First, add a new territory from Mapline’s repository. Type CANADA CENSUS into the searchbar and select CANADA CENSUS TRACTS.
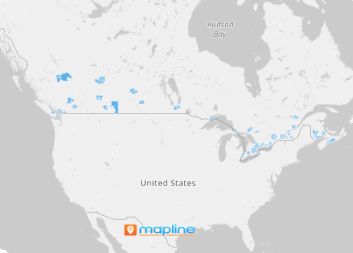
And BAM! You’ve added the territory boundaries you need. Wasn’t that easy?
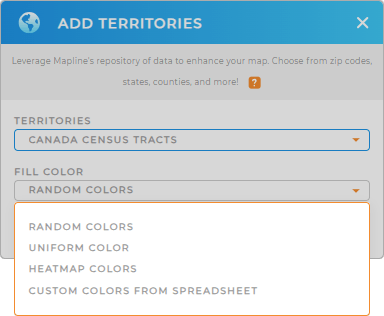
There’s just one more step– selecting which colors you’d like to use on your map.


Pro Tip: Mapline’s Repository offers a wide range of territory boundaries for Canada. From Canada provinces to Canada census agricultural regions, try mapping different boundaries to unveil trends and patterns in your data.
CHOOSE CENSUS TRACT COLORS
Choosing a territory color is an integral part of mapping. It helps ignite ideas and tell stories that are hidden behind rows of data. Whether you choose to apply custom color from your spreadsheet, or heatmap colors, or even random and uniform colors for attractive map presentation, the right color style for your territories empowers you to dig deep into new location insights and level-up your decision making prowess.
To enhance your map andalytics, choose the color styling you prefer and click OK.

GET NEW TERRITORY INSIGHTS
Now that you’ve added Canada census tracts to your map, try some of these powerful capabilities to enhance your analytics:
- See the data you need in a glance with map labels
- Manage orders more efficiently
- Display information you need at any given time


