CANADA POPULATION CENTERS
- Territory Guide
- CANADA POPULATION CENTERS
Add Canada population centers to your map and tap into a powerhouse of analytics!
Looking to gain deeper insights into your business’s market reach and customer base in Canada? Adding Canada Population Centers to your Mapline map is the perfect solution. These areas represent significant demographic concentration, providing invaluable insights for businesses in various industries.
Here’s how to tap in to key insights that help you take your operations to the next level!
WHAT ARE CANADA POPULATION CENTERS?
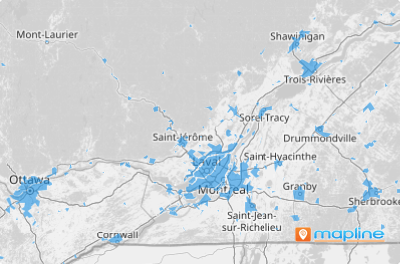
Canada Population Centers refer to areas with significant concentrations of population, typically urban or densely populated regions. This boundary is focused on a territory per square kilometer with at least 1,000 people.
Population-level analysis is crucial for professionals in any industry. For example, an operation manager seeking to optimize resource allocation and logistics can use these boundaries to strategically position distribution centers, plan efficient delivery routes, and target marketing efforts to densely populated areas.
Or, a business looking to expand their market could identify ideal locations for new stores based on population density and demographic trends, thereby maximizing sales potential and minimizing operational costs. Let’s dive in to how to create a map of Canada’s population centers!
ADD POPULATION CENTERS
Unlock Canada’s hidden potential by mapping its population centers with Mapline! Gain deep insights that reveal untapped opportunities, fueling smarter development strategies.
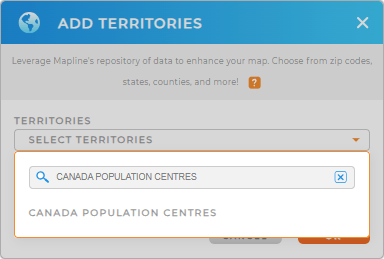
Add Canada population centers to your map in just a few seconds! First, add a new territory from Mapline’s repository. Type CANADA POPULATION in the searchbar and select CANADA POPULATION CENTERS.
And that’s it! You’ve added the right area to your map–now let’s move on to Step 2.


Pro Tip: Mapline’s Repository of territory boundaries spans the globe, empowering you to take your mapping beyond Canada. In addition to population centers, you can also add Canada designated places, Canada consolidated subdivisions, Canada census tacts, and more!
CHOOSE POPULATION CENTRE COLORS
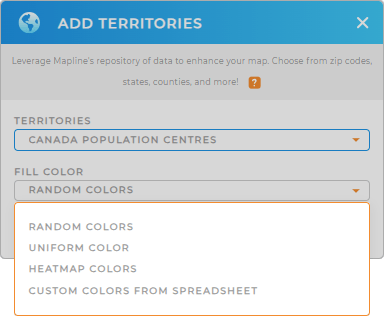
There’s no better way to make your map easy to use than by adding custom colors to your territories. Whether you want to analyze market trends or map your target audience, a color-coded map makes it quick and easy to get the insights you need.
Just select your desired color style, then click OK. It’s really that easy!

GET NEW TERRITORY INSIGHTS
Now that your map is ready to use, let’s dive into some key insights you can derive from your territories:
- Present a visual language to convey crucial information
- Seamlessly incorporate new data into your analytics
- Add a new view to securely share your Mapline datasets and visualizations with your team


