
Be Empowered with a Belgium Region Map
Map Belgium Regions to Gain Actionable Insights for Your Organization
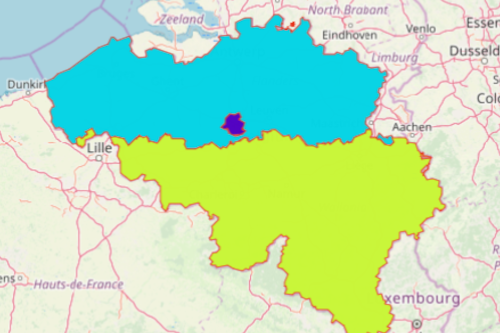
A Belgium region map is a great resource when it comes to uncomplicating the structured geographical areas of the country. Mapline provides different territory boundaries for Belgium that are available to use. The region boundary is structured uniquely. It comprises the Flemish, the Walloon, and Brussels-Capital Regions. When these territory boundaries are overlaid on a map along with Excel data, a powerful visualization will come out. You will detect how your location data may be somehow connected with each other or with their respective boundaries.
Use a Belgium region map to draw a business plan that tailor-fits your target market. Your map will definitely help in showing you the visualization that you need to help you do away with the burdensome data analysis.
Overcome Hurdles by Mapping
Start monitoring how your business is doing or where your untapped market is located. Begin by creating a map of Belgium regions. Just follow these steps:
- Create a Mapline account and login.
- Click the orange “Add New Items” button.
- Select “New Map” on the drop down arrow.
- Give your map a name and click “OK.”
- Click the “Add” button from the left sidebar.
- Select the “Territories” option.
- Click “From Mapline’s Repository.”
- From the “Territories” select “Belgium Regions.” You can also enter that on the search bar.
- Select how you want your boundaries to be colored in “Fill Color” (Random Colors, Uniform Color, Dynamic heat map colors, or Custom colors from spreadsheet).
- Click “OK.”
Make your map of Belgium regions be part of your organization’s planning stage. Sign up now to learn more how other mapping tools can be used by your organization.