
Drive out More Insights by Mapping Municipalities of Bulgaria
Experience Level-Up Data Interaction in a Municipality-Level Map
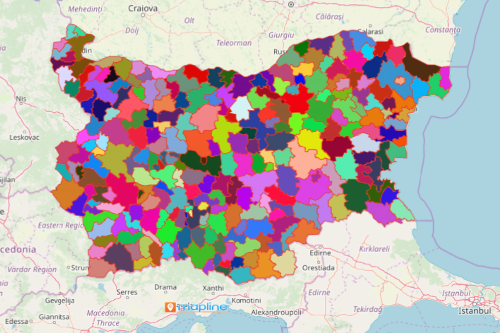
Mapping municipalities of Bulgaria combined with demographic data shows a powerful visual that allows you to understand how data interrelates with each other. Bulgaria is a beautiful country that lies on the side of the Balkans in Southern Europe. It is divided into 265 municipalities. The country is rich in industrial economy. Adding location data on a municipality map can work together powerfully! The insights uncovered from the interrelationships of Excel spreadsheet data are often used in decision-making for growth opportunities, risk management, network marketing, and many more.
Mapline’s supersets help augment your data with the information that you don’t have. This tool makes territory mapping more practical because you get to assign the customers to sales teams automatically.
A Minute or Less to Map Municipalities of Bulgaria
From distance analysis to visualizing coverage networks, Mapline got you covered. But first, spend a few seconds building your municipal boundary map:
- Create a Mapline account and login.
- Click the orange “Add New Items” button.
- Select “New Map” on the drop down arrow.
- Give your map a name and click “OK.”
- Click the “Add” button from the left sidebar.
- Select the “Territories” option.
- Click “From Mapline’s Repository.”
- From the “Territories” select “Bulgaria Municipalities.” You can also enter that on the search bar.
- Select how you want your boundaries to be colored in “Fill Color” (Random Colors, Uniform Color, Dynamic heat map colors, or Custom colors from spreadsheet).
- Click “OK.”
Sign up now and drive out more insight by using top of the line mapping tools for your data discovery.