
Spot Economic Development on a Liechtenstein District Map
A Better Way to Understand Liechtenstein Through Mapping
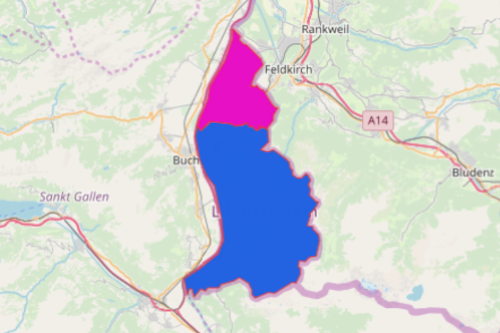
A Liechtenstein district map is a handy tool when dealing with asset analysis. Liechtenstein is a European country comfortably nestled between Austria and Switzerland. It has 11 municipalities grouped into two districts – Unterland and Oberland. Yes, we know that Unterland depends on Schellenberg while Oberland District depends on Vaduz. But other than that, there is more to it than just looking at the divisions of these two districts.
When mapping the districts of Liechtenstein, we can see how each district fare when it comes to economic growth. By adding your locations data, you can discover the connections between each location, as well as their relationship with their territory boundary. Through mapping, you have the power to know things ahead – risks, potentials, and opportunities.
Discover More with Mapping for Greater Impact
Steps to Create a Liechtenstein District map:
- Create a Mapline account and login.
- Click the orange “Add New Items” button.
- Select “New Map” on the drop down arrow.
- Give your map a name and click “OK.”
- Click the “Add” button from the left sidebar.
- Select the “Territories” option.
- Click “From Mapline’s Repository.”
- From the “Territories” select “Liechtenstein Districts.” You can also enter that on the search bar.
- Select how you want your boundaries to be colored in “Fill Color” (Random Colors, Uniform Color, Dynamic heat map colors, or Custom colors from spreadsheet).
- Click “OK.”
By mapping Liechtenstein districts, you will get to understand each district’s strengths. Sign up now to know more about building a stronger community. Try to use more powerful mapping tools to visualize the growth potentials of each district.