Quick Reference Guide
Maps: Add Pins
SELECT PIN SOURCE
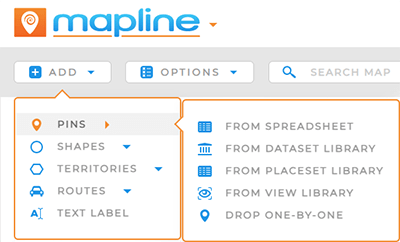
If you haven’t already, go ahead and create a new map or open an existing map. To add pins, just click the blue Add + button in the top menu of your map, and hover over Pins.
The following options will appear:
- From Spreadsheet: Copy location data from a spreadsheet and paste it directly into Mapline. Ideal for importing bulk locations.
- From Dataset Library: Import locations from your existing Mapline datasets.
- From Placeset Library: Populate your map with pre-defined Placeset data.
- From View: Pull location data from your existing Mapline Views. Ideal for sensitive data that needs to be plotted on a map.
- Drop One-by-One: Add custom locations to your map one at a time. Ideal for adding a handful of locations at a time.
Pro Tip: If your locations change often, consider the Mapline API. This empowers you to keep data synced between your application(s) and Mapline or vice versa. Move information seamlessly, get immediate insights based on real-time data, and let the API do the heavy lifting.
ADD PINS FROM SPREADSHEET
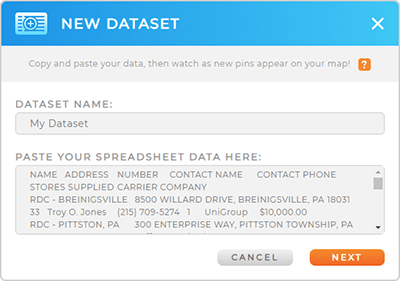
After selecting Add Pins > From Spreadsheet, the New Dataset window opens. This shortcut allows you to create a new dataset directly from your map! It’s the perfect way to bring data into your map without navigating to another page in Mapline.
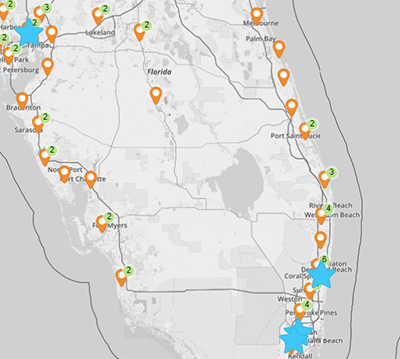
Once you’ve added the data, your locations will automatically populate on your map.
The new dataset you just created is also accessible from the Datasets Library. The name you choose here is what you’ll see in the library later on.
ADD PINS FROM DATASETS
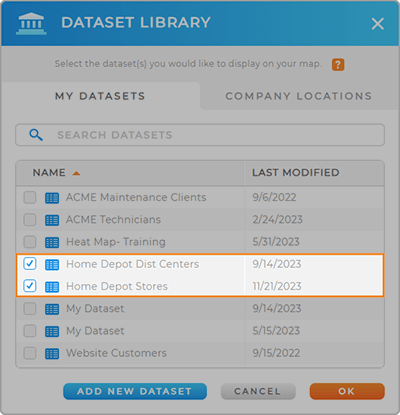
Pull location data directly from the Datasets Library in Mapline.
If you have more than a few datasets saved to your library, just use the search bar to find the correct dataset even faster!
Once you’ve selected the dataset(s) you need, click OK and your locations will automatically populate on the map.
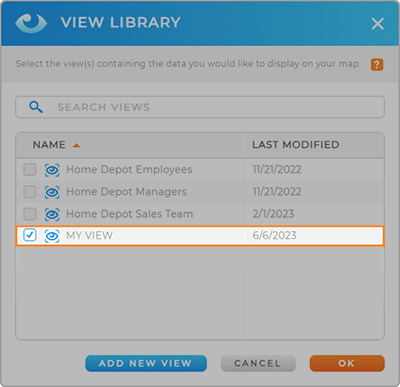
ADD PINS FROM VIEWS
Pull location data directly from your Mapline views! If you need to create a new view for this map, just click ADD NEW VIEW at the bottom of the View Library lightbox.
Or, use the search bar to find your existing view(s) even faster!
Your map’s content is based on your view settings, and the person who owns the dataset can manage these settings.
DROP PINS ONE-BY-ONE
Need to customize your pins even further? Or maybe you just need to add a few locations that weren’t in your original dataset?
Click the points on your map that need pins, and BOOM! You’ve got additional locations.
Pins that are dropped one-at-a-time will not be included in your original dataset unless you add them manually.
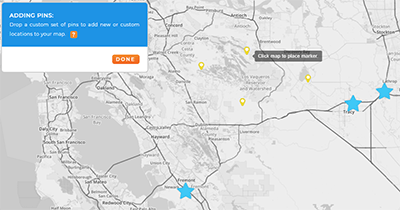
Pro Tip: When you drop pins one at a time, Mapline automatically adds the latitude and longitude of each location to your pin dataset. This is a seamless, efficient way to capture precise location data on the spot!
GET THE MOST FROM YOUR PINS
Adding pins is just the beginning. Once you’ve plotted your locations, the possibilities are endless. Here are some ways to get started using map pins to analyze your data:
- Style map pins
- Create optimized routes
- Add a radius around pins
- Calculate distance between pins
- Optimize deliveries with advanced routing
- Identify where your target market lives with demographic data
There’s no limit to what you can do with your data. The only question is, how will you get the most out of mapping your locations?