
Mapping Municipalities of Slovakia to Enhance Data Analysis
Study Economic Growth Through Municipality-Level Mapping
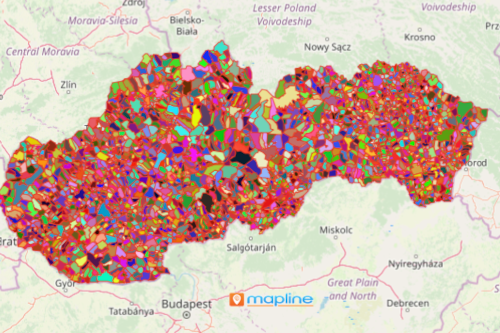
A growing number of organizations from different sectors are mapping municipalities of Slovakia for data analysis. Slovakia is a developed country located in the heart of Europe. It is divided into 2,891 municipalities. Because its economy is one of the fastest-growing in Europe, no wonder more and more organizations use a municipality map for data analysis. A map of Excel data with an overlay of municipality boundaries results in a powerful data visualization that immediately shows patterns to help develop economic programs. Whether your organization is looking for programs with short-term or long-term objectives, mapping provides real-time and effective solutions!
One tool that is popular in boosting location analytics is the territory reporting tool. A territory report is integral to understand which locations fall within each territory boundary. It provides summaries of quantitative data for each territory. What’s even better is that the reports can be accessed quickly. In just a single click, you can view and download the report with these settings: count, sum, average, maximum, and minimum.
Mapping Municipalities to Better Understand Your Data
Create your map of municipalities now and see for yourself how you can easily access territory reports.
- Create a Mapline account and login.
- Click the orange “Add New Items” button.
- Select “New Map” on the drop down arrow.
- Give your map a name and click “OK.”
- Click the “Add” button from the left sidebar.
- Select the “Territories” option.
- Click “From Mapline’s Repository.”
- From the “Territories” select “Slovakia Municipalities (2019).” You can also enter that on the search bar.
- Select how you want your boundaries to be colored in “Fill Color” (Random Colors, Uniform Color, Dynamic heat map colors, or Custom colors from spreadsheet).
- Click “OK.”
Sign up now to start reaping the benefits of using the territory reporting option for your data analysis.