
Perform Business and Market Analysis by Mapping Slovenia Municipalities
Municipality-Level Mapping for a More Focused Location Analysis
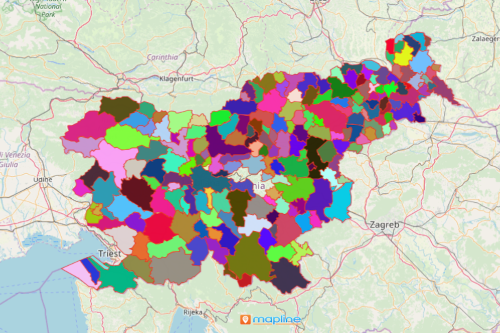
Location data can be better visualized and understood by mapping Slovenia municipalities. Slovenia is a developed country comfortably nestled in the heart of Europe. By adding an overlay of municipal boundaries on a map, you can monitor how your business fares. For example, you may want to do market analysis for each municipality. By adding an Excel spreadsheet of location data to a municipal territory map, you get a clear picture of how your business fares to one location compared to another.
One type of map that proved to be indispensable in sales and marketing analysis is a sales heat map. It allows you to know exactly where customers are or to find the most optimal location to start or expand a business. It uses color-coded concentrations to show comparison between densely populated and the least populated areas. It provides clear visibility into sales activities.
Analyze Data Connections by Adding Municipality Boundaries
Make the most of your precious time by creating a map in less than a minute! Start performing an in-depth analysis once your map is generated.
- Create a Mapline account and login.
- Click the orange “Add New Items” button.
- Select “New Map” on the drop down arrow.
- Give your map a name and click “OK.”
- Click the “Add” button from the left sidebar.
- Select the “Territories” option.
- Click “From Mapline’s Repository.”
- From the “Territories” select “Slovenia Municipalities.” You can also enter that on the search bar.
- Select how you want your boundaries to be colored in “Fill Color” (Random Colors, Uniform Color, Dynamic heat map colors, or Custom colors from spreadsheet).
- Click “OK.”
There are always new mapping tools to try in Mapline! Sign up now and take advantage of using more mapping tools to analyze connections on multiple datasets to identify new trends for your growing business.