
Slovenia Region Map – a Strategic Approach to Understand the Community’s Strengths
Region-Level Mapping Identifies Gaps Between Locations
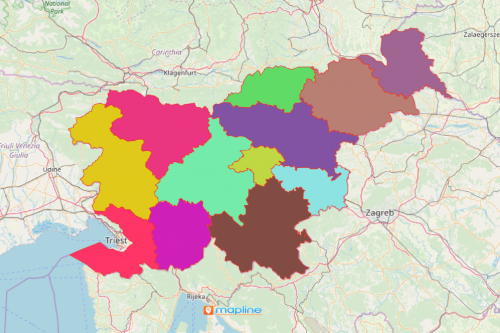
Economic developers and leaders depend largely on a Slovenia region map. Slovenia is a developed country nestled at the heart of Europe. It has 12 statistical regions. When a map has an overlay of region boundaries, it creates a powerful data visualization. By combining location data and territory boundaries, economic developers are able to dig deeper and realize each region’s strengths. Moreover, the users can add more datasets like demographics to understand more on how to build a strong community with a sustainable environment.
With proper uses of powerful mapping tools, data connections reveal a lot about the community. They identify reasons how it can identify opportunities, study the competition, or mitigate risks. One mapping tool that is beneficial for customized data analysis is the draw pad. The draw pad allows the users to manually add shapes or add markers. These functions are used particularly to determine the distances from one location to another. Additionally, an added marker serves as a landmark that can be used to study the provincial boundaries, to determine new markets, or to discover new investments.
Build Your Slovenia Region Map Today
How? Get started by simply following these 10 easy steps:
- Create a Mapline account and login.
- Click the orange “Add New Items” button.
- Select “New Map” on the drop down arrow.
- Give your map a name and click “OK.”
- Click the “Add” button from the left sidebar.
- Select the “Territories” option.
- Click “From Mapline’s Repository.”
- From the “Territories” select “Slovenia Statistical Regions.” You can also enter that on the search bar.
- Select how you want your boundaries to be colored in “Fill Color” (Random Colors, Uniform Color, Dynamic heat map colors, or Custom colors from spreadsheet).
- Click “OK.”
Sign up now and take advantage of using only the best mapping tools for customized data analyses and identify gaps between locations.