
Why a Sweden Municipality Map is Used for Decision-Making
Municipality Map – A Great Tool for Monitoring Business Activities
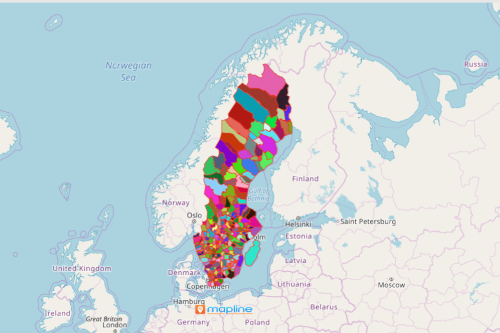
A closer look at a Sweden municipality map allows you to understand the product distribution of your business more thoroughly. Sweden is one of the largest European countries. Its 31 county councils are further divided into 290 municipalities. Organizations from different sectors refer to an Excel data map with an overlay of municipality boundaries to monitor, understand, and improve their business activities. The map allows them to focus on data relationships and deep-level location analysis relevant for their decision-making.
Route building and heat mapping are two of the most sought-after mapping tools for data analysis. Route building and optimization tools help to organize plans for sales trips or onsite inspections. On the other hand, heat maps promote visually intuitive ways of seeing data concentration.
A Map of Municipalities for Level-Up Data Analysis
Follow these 10 easy steps to create a map with municipality boundaries:
- Create a Mapline account and login.
- Click the orange “Add New Items” button.
- Select “New Map” on the drop down arrow.
- Give your map a name and click “OK.”
- Click the “Add” button from the left sidebar.
- Select the “Territories” option.
- Click “From Mapline’s Repository.”
- From the “Territories” select “Sweden Municipalities (2019).” You can also enter that on the search bar.
- Select how you want your boundaries to be colored in “Fill Color” (Random Colors, Uniform Color, Dynamic heat map colors, or Custom colors from spreadsheet).
- Click “OK.”
Sign up now to know more advanced mapping tools for data analysis for decision-making.