THE NETHERLANDS PROVINCES
- Territory Guide
- THE NETHERLANDS PROVINCES
Add a map of The Netherlands provinces to your analytical toolkit and enhance your business analytics! With detailed province-level insights, you can make more informed decisions, optimize your strategies, and uncover new opportunities. This helps in building stronger customer relationships, increasing lead generation, and avoiding costly delivery errors. Visualizing factors in relation to these provincial boundaries allows you to streamline operations, target marketing efforts more effectively, and explore new growth opportunities.
WHAT ARE THE NETHERLANDS PROVINCES?
The Netherlands is divided into 12 provinces, each with unique characteristics and economic significance. These provinces include Noord-Holland, Zuid-Holland, Utrecht, and Noord-Brabant, among others. Each province has its own population density, economic activities, and regional strengths. Mapping these provinces provides valuable geographic insights that can significantly enhance your business analytics.
For example, Noord-Holland and Zuid-Holland are highly populated and economically significant regions, home to major cities like Amsterdam and Rotterdam. These areas are hubs for commerce, finance, and international trade. Meanwhile, provinces like Gelderland and Noord-Brabant have strong industrial bases and are known for their manufacturing and technological innovations. By incorporating the Netherlands provinces into your map, you gain a clearer understanding of regional dynamics that impact your business.
ADD PROVINCES TO MAP
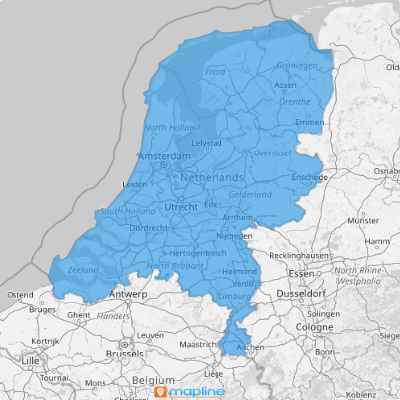
With the provincial boundaries added to your map, you can visualize opportunities and errors and instantly act to mitigate them. A province map of The Netherlands gives you the power to monitor and manage your operations within each province on a more granular level.
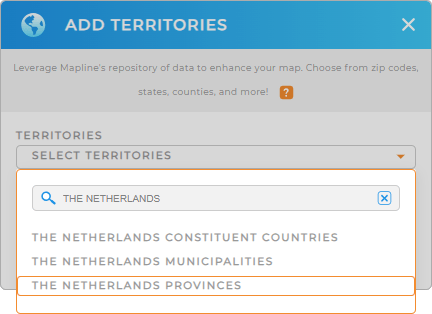
First, add a new territory from Mapline’s repository, then type NETHERLANDS into the searchbar and select THE NETHERLANDS PROVINCES.


Pro Tip: Mapline’s extensive repository of territory boundaries includes worldwide regions, allowing you to expand your mapping capabilities beyond the Netherlands. Explore The Netherlands Constituent Countries, The Netherlands Municipalities, and The Netherlands Provinces, to gain deeper insights and make more strategic decisions.
CHOOSE PROVINCIAL COLORS
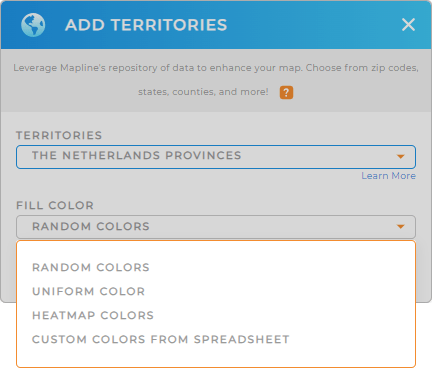
Color-coding the Netherlands provinces is a crucial step for enhancing data visualization and business analytics. Assigning colors helps you quickly identify regional trends, performance metrics, and areas requiring attention.
Simply select your desired color styling, click OK, and your map is ready to go!
This visual distinction makes data interpretation easier and supports more effective business strategies.

GET NEW TERRITORY INSIGHTS
But that’s not all! Here are some powerful ways to enhance your analytics in moments:
- Automate your route planning and cut back in mileage
- Visualize and analyze your service coverage areas to generate new insights and fine-tune your strategies
- Access detailed territory reports to gain in-depth insights into regional performance and opportunities


